How to make your own Photo Viz
By Hugo Belin
Dust off your photo archive and put it to work! In this post I’m going to show you how to take your photos into a basic Tableau dashboard that will have them located in a map. This map will show where those photos were taken allowing you to group them and see significant events by location and optionally over time
We will also review options for hosting your photos in a way that can be embed-able and useful for our Tableau dashboard. We want users to interact with the Tableau dashboard by selecting a data point in the map and get the related photo (or set of photos). This is by no means a comprehensive guide but it should get you started and give you some ideas to perfect your work (I’m even refining the details myself and looking for ways to improve the hosting of my photos)
I will also dive into some of the technical details of my work so be prepared to review some code. The code samples I will be sharing will be very basic and could be easily replaced with non-coding alternatives, these samples are based around hosting my site and preparing the work for some types of photo hosting. This site is built using the Hugo framework and some of the code examples are tailored to use this framework; if you’re into coding (JavaScript mostly) it should be no major trouble to adapt the code to other frameworks and systems
A little disclaimer 😁 I’m no Tableau expert and I’m no code super expert, I’m sure things can be definitively improved (consider these as V1 at the time of writing this post). I’m simply putting few concepts together and I’m sharing this so you can also build upon these concepts and adapt them according to your expertise
Mechanics
Let’s talk about the mechanics of this. We’re going to need few pieces of data as follows:
- A set of photos you’d like to share (obviously). For it to work the photos should be hosted in a way that can be accessible publicly (or you’ll have to build some authentication mechanism in your Tableau dashboard). Before building our dashboard we need to decide whether we want to access our photos individually or by groups. Locating photos in our dashboard individually give us granular control over its location at the expense of extra work since you would need the coordinates of each photo. Locating photos in our dashboard by groups is more convenient but you loose the granularity, for a single data point in the map you would access a group of photos so the location might be only representative of that group of photos. In this post I will explore both options and give examples
- Latitude and longitude of the photos you want to add to your dashboard. If you plan to locate single photos in the dashboard you’ll need the coordinates of each photo. If you plan to add groups of photos you can pick a representative location of each group. More details on how to get these coordinates on this later
- Title or description for each photo/group of photos. We can show this information via tooltips or in the dashboard
- Photo or group of photos URL. We will explore this out and will have this once we find the proper hosting for it
- Selecting our data source. Storing the aforementioned data will constitute our data source and Tableau needs to be able to access that
Individual Photos vs Groups of Photos
As mentioned before you could decide to pinpoint individual photos or groups of photos in the Tableau Viz. There are several things to consider:
Getting Coordinates of Individual Photos
If the photos you want to share were taken with a phone chances are that you can see the location of any particular photo. For our exercise we’ll need these coordinates in
decimal degrees instead of hour-minute-second degrees. If your device gets you this metadata in HH:MM:SS degrees you will need to convert them to decimal degrees by using this
online tool
to perform the conversion. There are multiple ways of getting this information, here are some of those:
- Use a third party app to read the metadata for you (I tried EXIF Metadata for iOS )
- Transfer your photos to a PC or Mac and read its metadata from there. Photos transferred as
.HEICformat usually include location metadata. For Mac OS open the photo on Finder, make sure the preview pane is displayed and scroll down the properties of the photo and find their location. If the location is inHH:MM:SSformat use this online tool to convert them before saving them

Photo coordinates from metadata on Mac
- Transfer your photos to a Mac and read its metadata via command line. Mac OS includes a command line utility
mdlsthat reads through the metadata on a given photo file. If you have large amounts of photos to add you can script this command quite easily to do it in bulk (I’ll leave the details of it to you 😉). To read the metadata simply pass the path to anmdlscommand, look forkMDItemLatitudeandkMDItemLongitudereturned properties. You can check the details of that command here
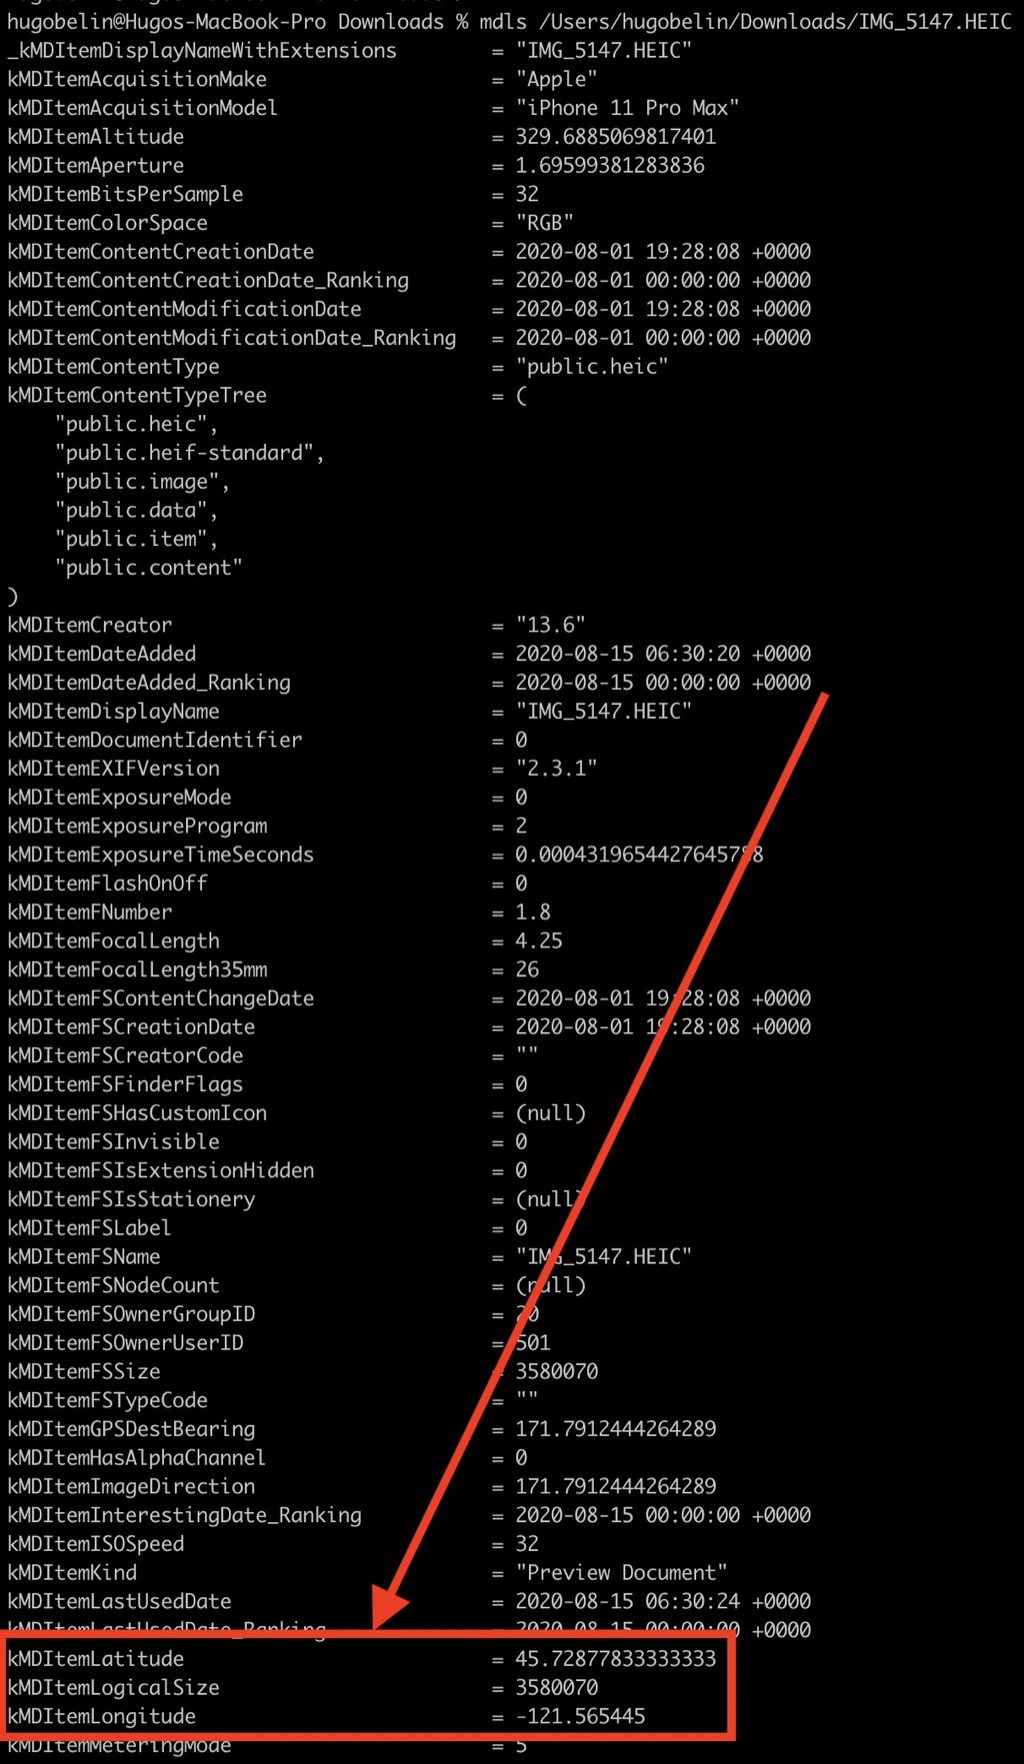
Read photo coordinates using mdls command
- A cross-device solution that works across iOS and Android is by using Google Photos . In iOS you can easily see the coordinates where your photos were taken, just open the App -> Open the picture you want to see its location -> Show the details of the photo (On you browser the process is similar, just need to open the Google maps thumbnail and it will contain the coordinates of the image)
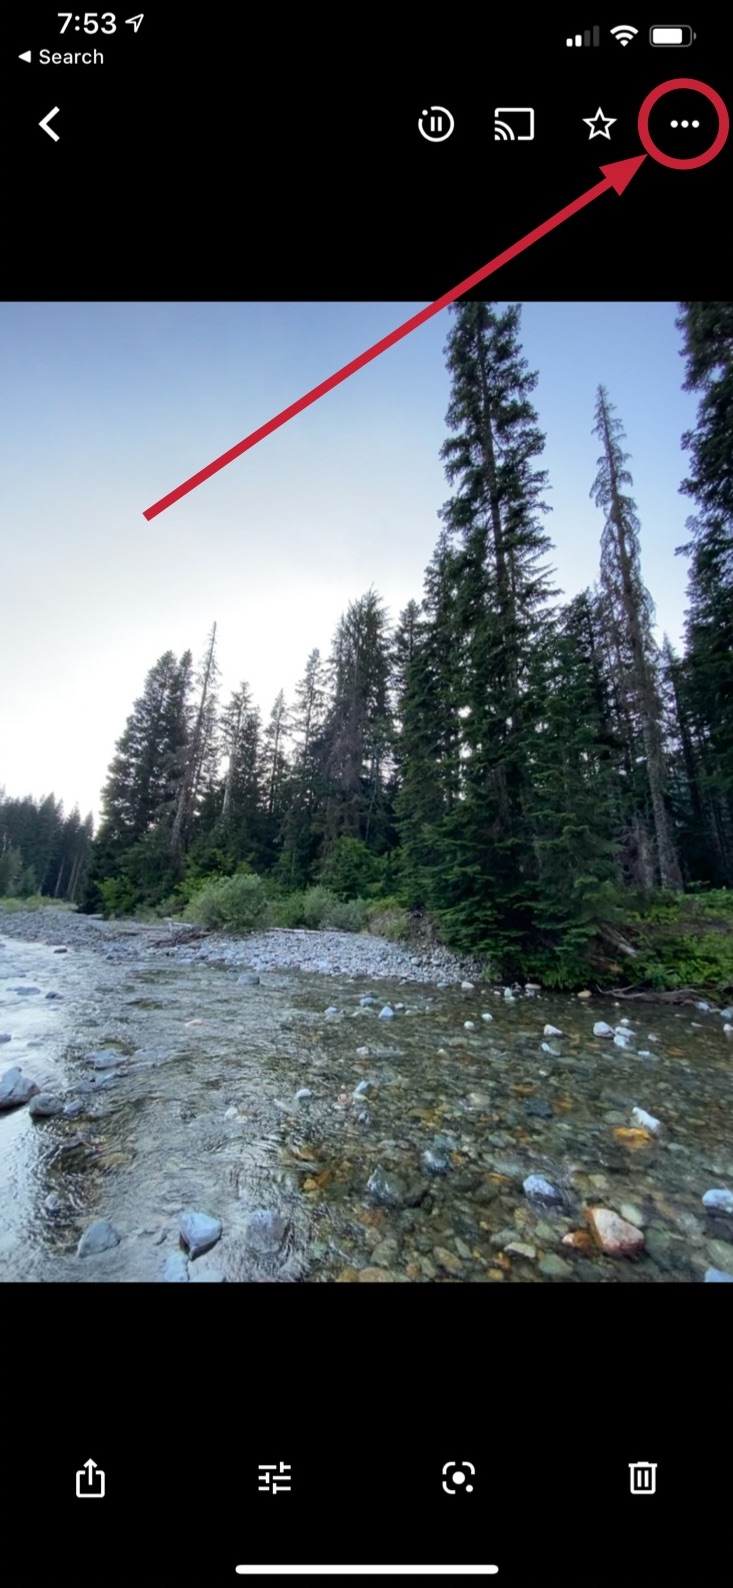
Google Photos App, getting picture info
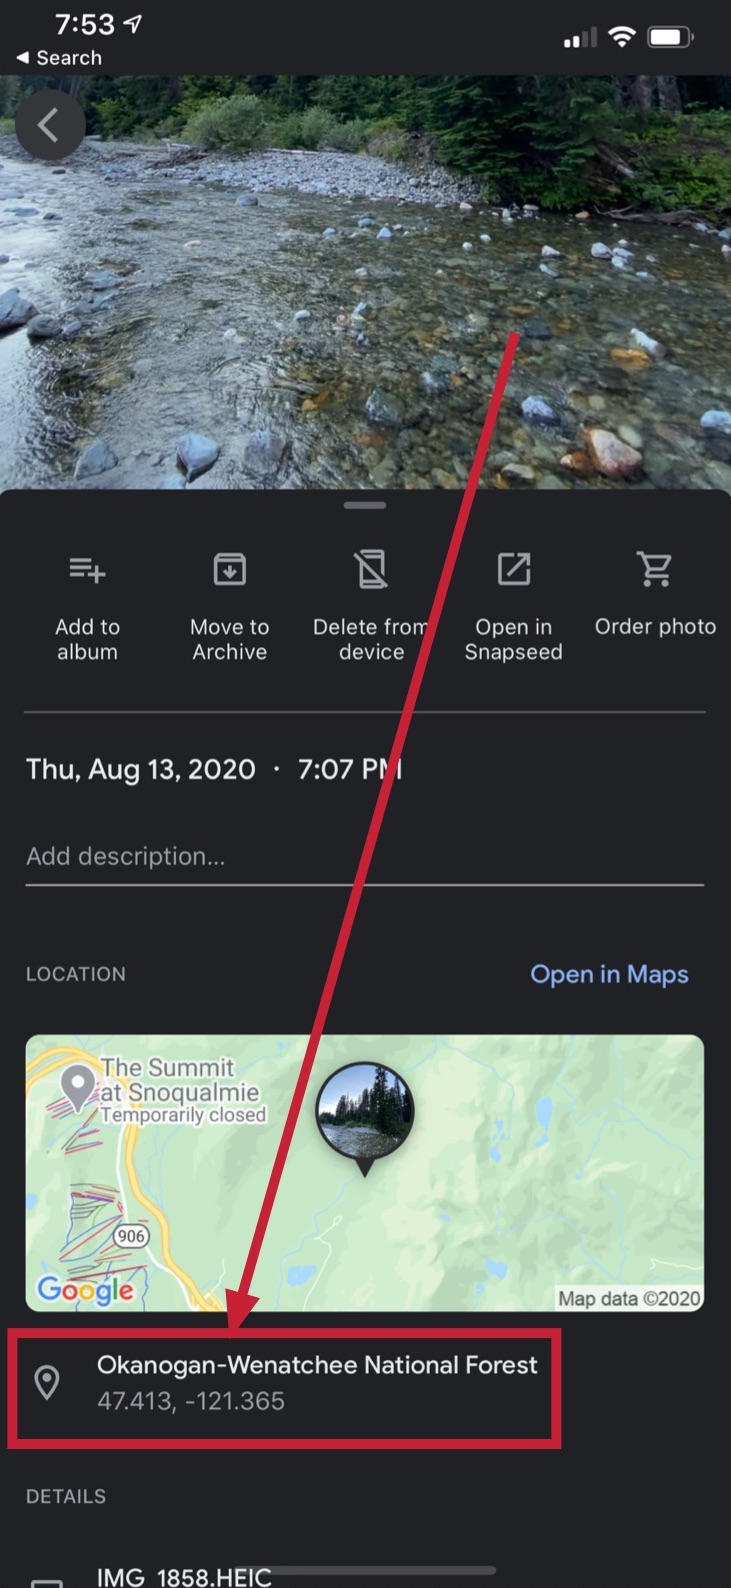
Coordinates of a given photo in Google Photos App
Getting Coordinates of Groups of Photos
If you decide to go for having your photos grouped you can use Google Maps . Decide how your pictures will be grouped together and assemble the groups, for each group select a representative location. Click on Google Maps on the desired location in order to create a pin on the map, when this occurs the coordinates of the pin are displayed in the bottom (see picture below), simply take these coordinates for your group of photos
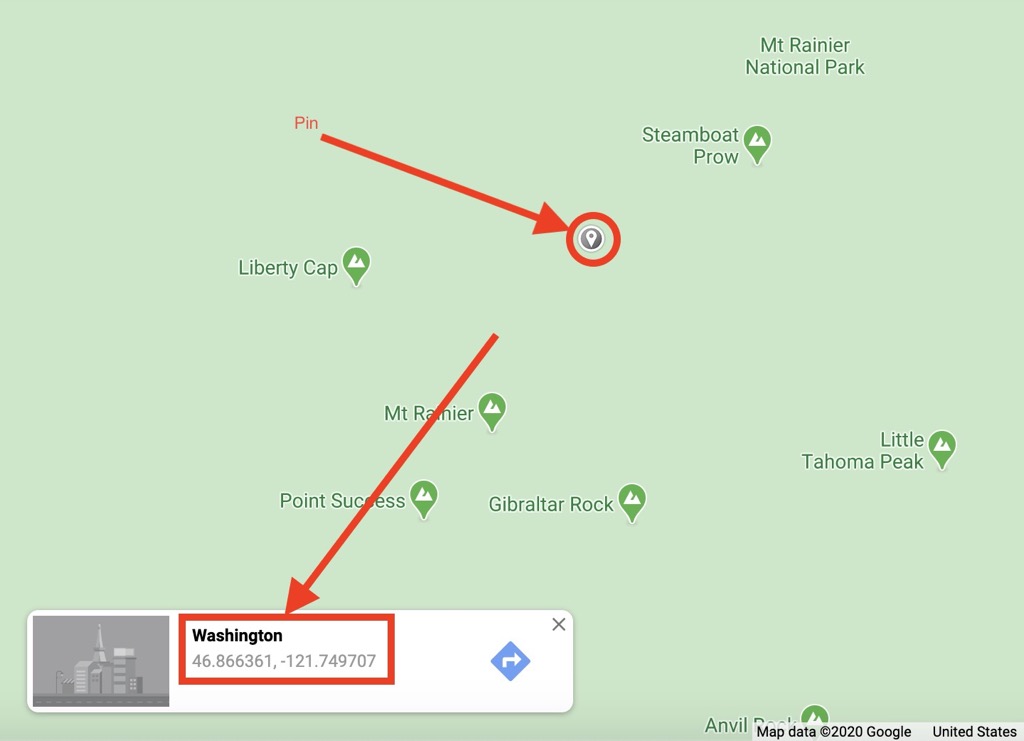
Coordinates of a pin in Google Maps
If this particular group of photos is about a location (like a park or a historic site) those can be easily selected in Google Maps . There are no rules however and you can create groups of photos as you like and pinpoint them anywhere
Hosting Your Photos
The first thing to note here is that the photos you decide to host for the Tableau dashboard have to have publicly accessible URLs or at least for the purposes of this guide (is
worth mentioning that with a little bit of knowledge you could include authentication mechanisms in your Tableau dashboard or control the access to those photos even by applying custom login
mechanisms in your web object). This website is hosted using
GitLab Pages
(so far I love it mostly 😍) so
naturally my first option was to include media like photos directly on my
GitLab Pages
site and while this is an easy
solution I didn’t think of the performance implications of it (if you want an example you can check out this post about
San Diego
where I included lots of media that impacted the performance quite a bit). If you don’t plan to have tons of views or the resolution of your images isn’t considerable, you could consider
hosting them this way, simply follow
their guide
and you will be ready pretty quickly (light knowledge of git
is required for this)
Ideally to host photos on a website you own it should be production-ready with all the goodness of a production website (to use a CDN with Geo-replication, load balancing, etcetera, you know the works 😉). Typically these websites are either hosted by third party providers or developed by a team of professionals with a good amount of resources. For us mortals we can provide a degraded performance website, pay for a decent performance, or find a compromise (delegate heavy asset loading to other services while keeping light assets on your lower performance hosting, we’ll eventually reach to such compromise in this post)
Let’s explore few other options
Unsplash
Storing your photos in Unsplash . Unsplash is great for storing images, it gives you all the goodness of a production-ready website (you can even get the pictures in different resolutions without having to do the resizing work yourself allowing you to optimize even further). You can easily get shareable links to the photo only (without Unsplash UI shell). There are a few downsides of Unsplash:- The photos are not only public (we’ll use URLs for the photos in our Tableau dashboard) but they’re also indexed and searchable. Unsplash intends to allow people to freely use and share pictures so any picture uploaded to the platform is easily discoverable (vs being accessible but not easily discoverable when hosting them on your own), you have to be ok with that
- Uploaded photos are subject to the Unsplash License which gives rights to anyone to use them and modify them and use them for any purpose (personal or commercial). Your photos might end up in commercial products and you have to be ok with this too
- You cannot upload just any photo you’d like. Very similar photos (like those of objects just taken from a slightly different angle) are taken down to keep quality up. Of course can’t include copyrighted content in your photo or it might be taken down
- If everything above is ok for you, using Unsplash for your photos will work easily for locating them individually in our map. This means that if you want to group them in a map you will need some extra work by adding a component that will allow you to circle through your photos (one option could be modifying a Bootstrap carousel to take inputs from query parameters that can be passed from the Tableau dashboard, we’ll do something similar later in the post, you can also use this Hugo's short-code carousel component that I created for this site as a starter for your Hugo site)

Insights Button on Business Profiles
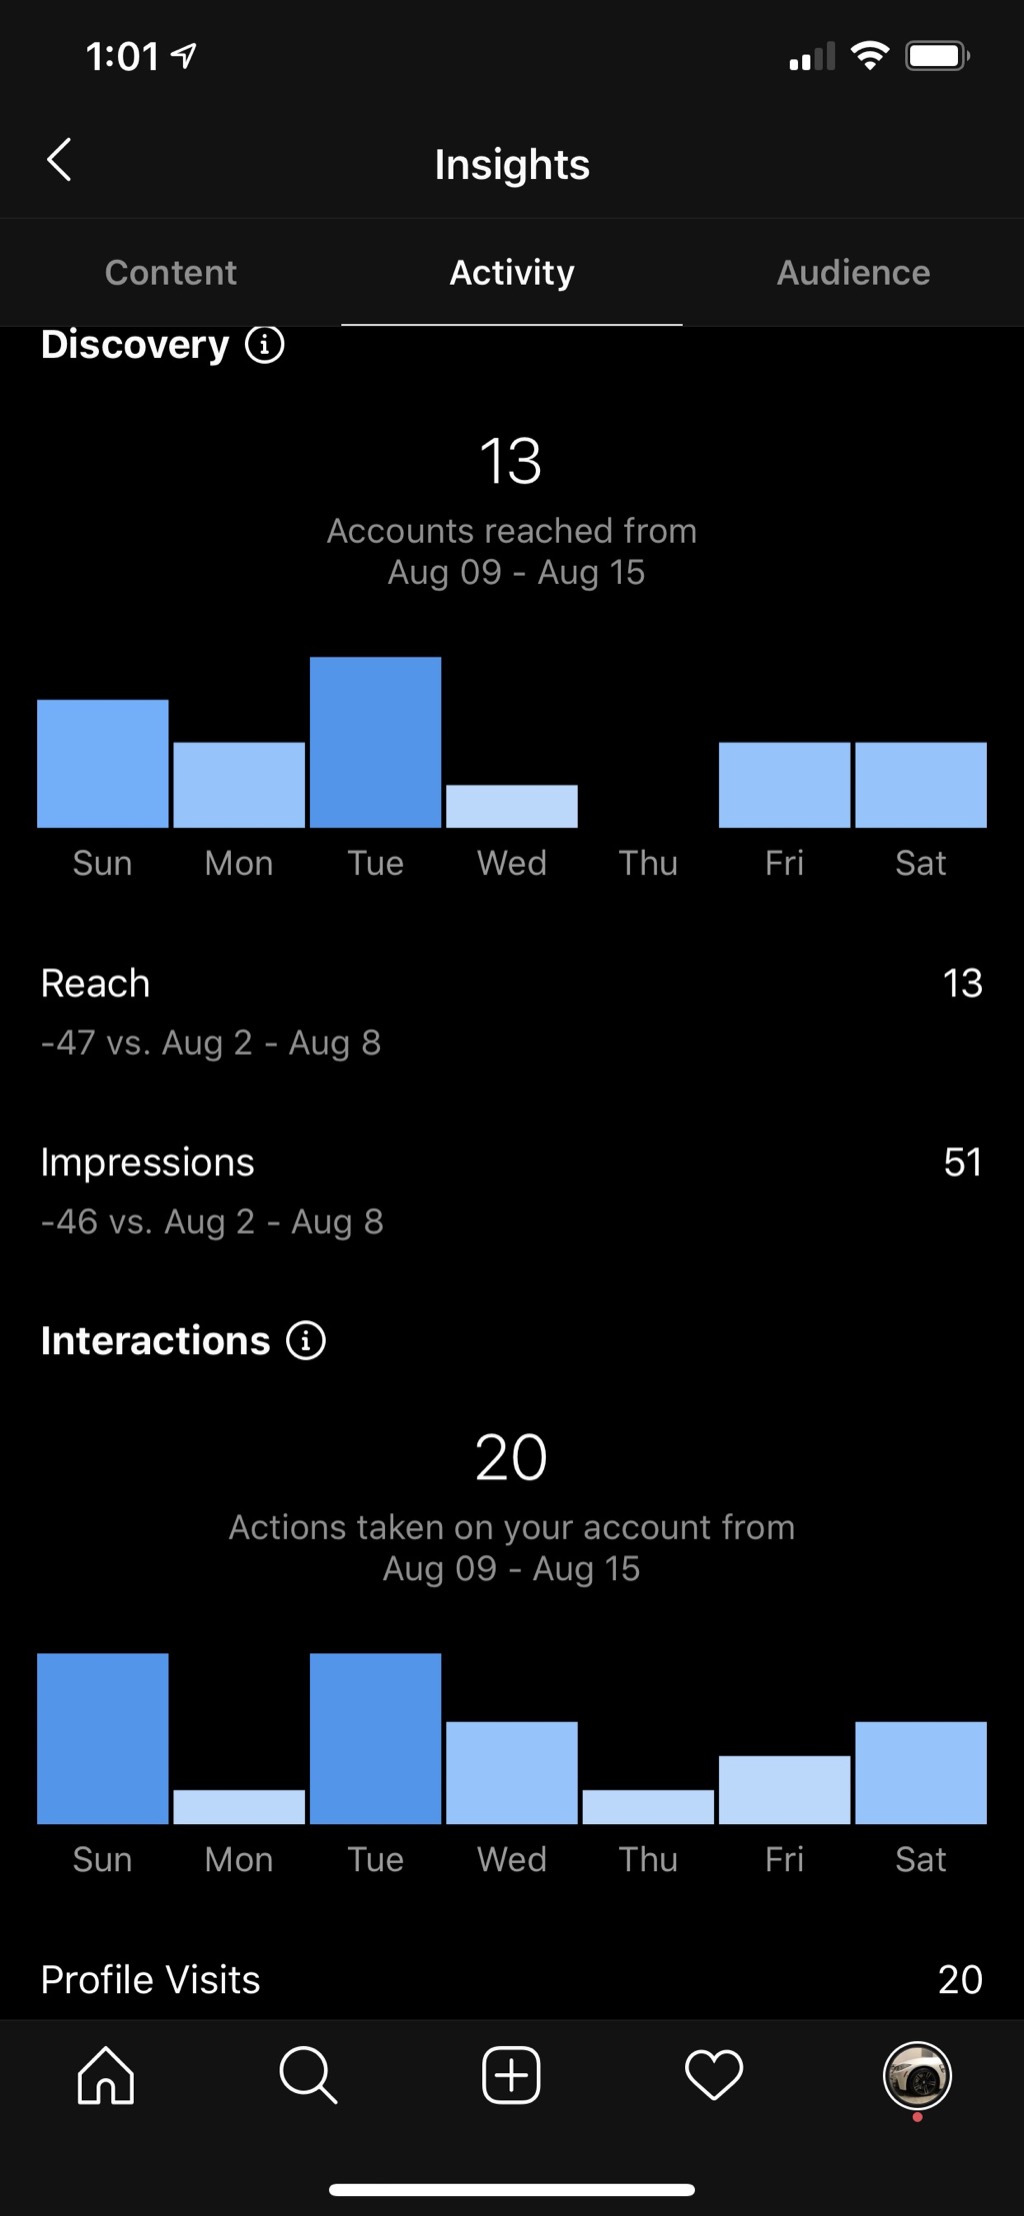
Activity Insights
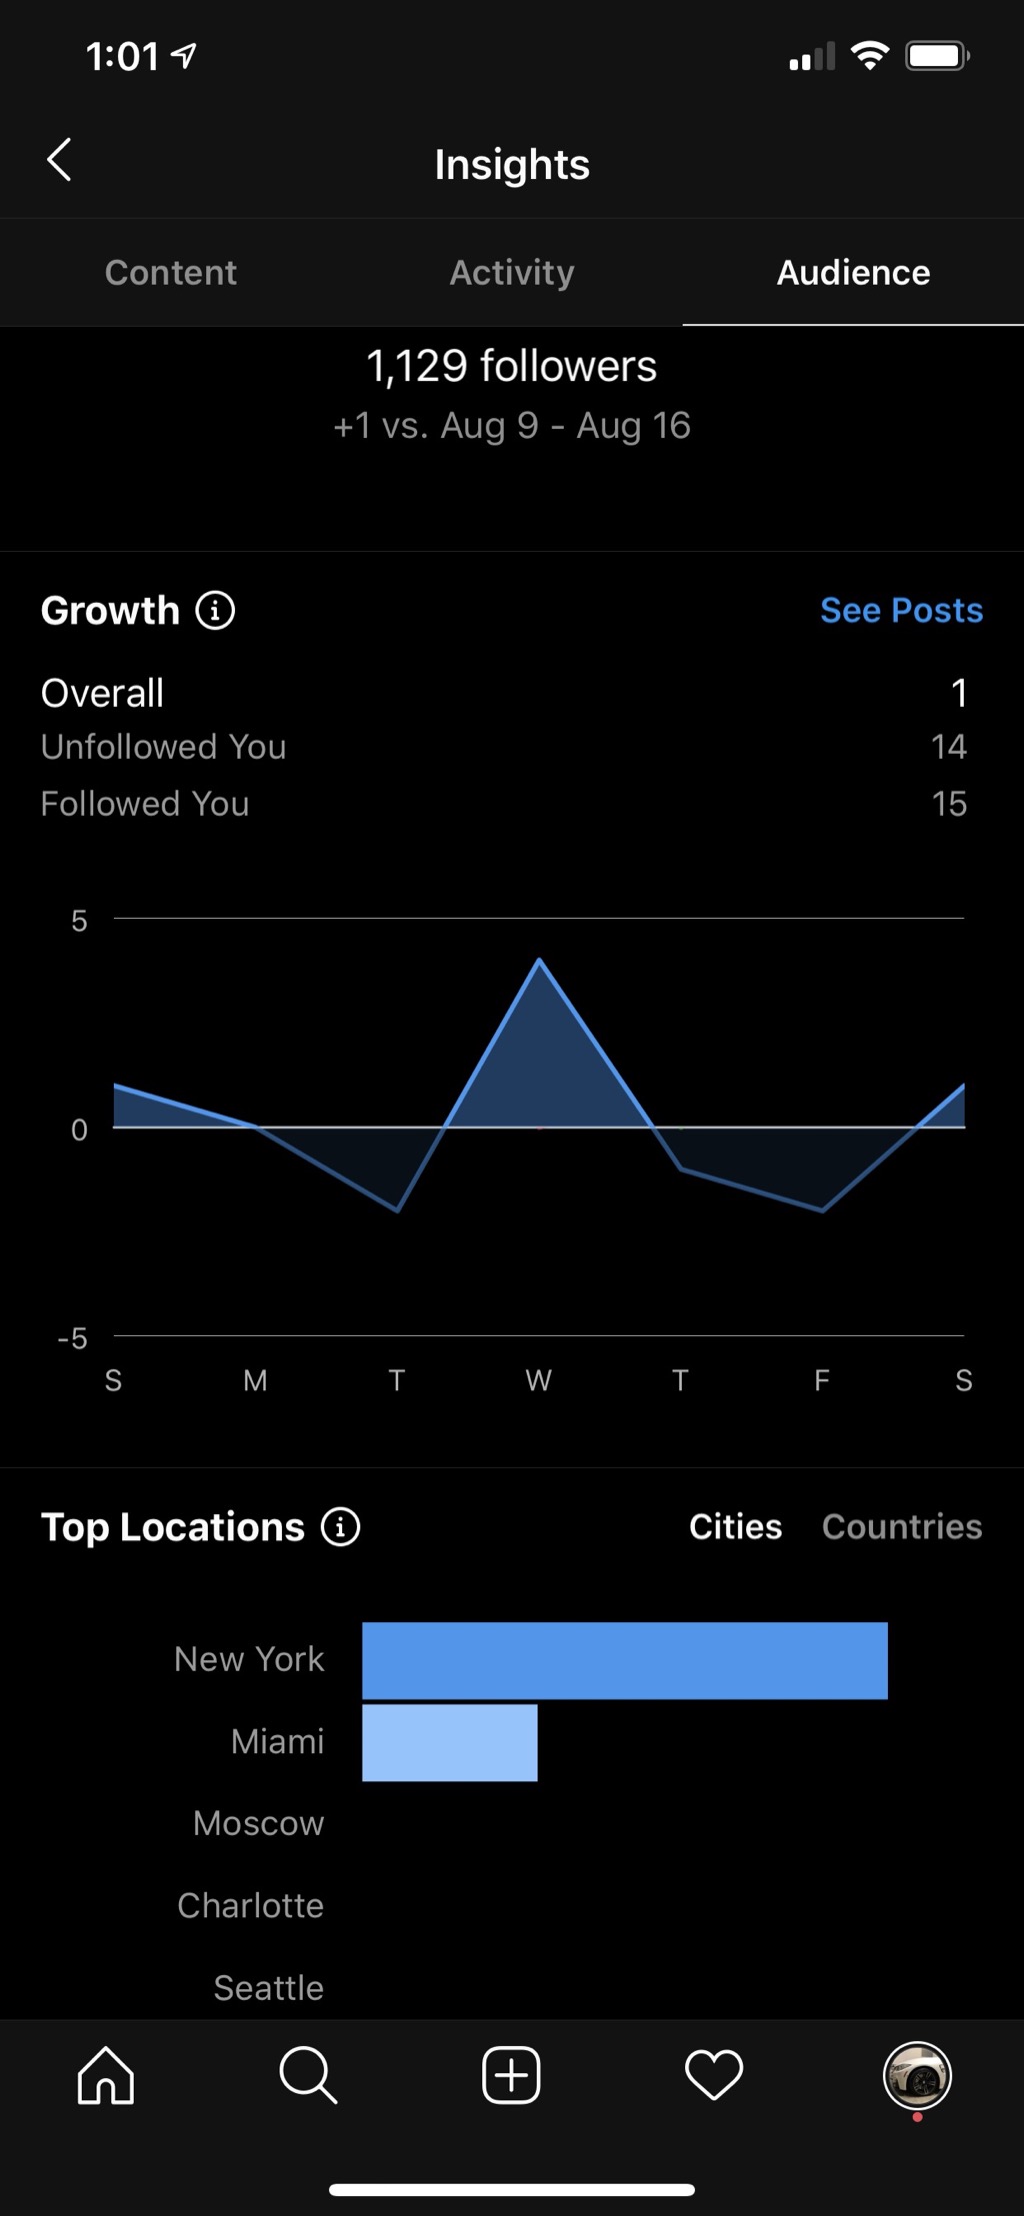
Follow Activity
Things to consider when embedding Instagram posts. You’re subject to their terms of use. Loading Instagram’s post by their URL directly might work in our Tableau Desktop but when publishing the
Viz to the web the web object becomes an iframe which is detected by Instagram and blocked accordingly. To be able to embed Instagram posts we need to setup a
Facebook developer account
, create an App, and finally add oEmbed Product to the App. Then we will have access to make API calls that can pull
the HTML required to embed our posts. Certainly not the easiest process but also not too complicated either 😉

Instagram refuses to show posts inside an iframe
Options That Did Not Work
I’ve explored the use of
Google Photos
to host your pictures, and while it works in Tableau Desktop, once you publish, the resulting Viz
has Google blocking the content as soon it detects it’s been rendered on an iframe (see the picture above). A key difference from Instagram is that there’s no client API for this, you need to
host a backend server that perform the API calls for you and then forward the results to your web client, since I’m not running backend infrastructure right now is not an option for me. If
you go this route and make it work let us know by commenting below
How to Make Instagram Work
I’m focusing on embedding Instagram because the other options are either straightforward and you should have no issues with them or quite custom and you should be ahead of me on those. If you don’t want to use Instagram you should be able to skip this section. At this point we’ve decided whether to store these images individually or by groups; if you decided to locate the photos individually create individual posts per photo on your Instagram profile, if you opted for groups of photos you can create posts that contain all the photos on the group. In this section I will outline the steps I took to make Instagram embeds work
Facebook Developer Work
Again if you use URL posts on the Tableau app it will work but as soon as you publish on the web Instagram will block embedded posts. To solve these issues we have to do some work:- Sign up for a Facebook Developer account you can use your regular Facebook credentials for this
- Create a new app that we will use to access Instagram, you can add an app from your dashboard
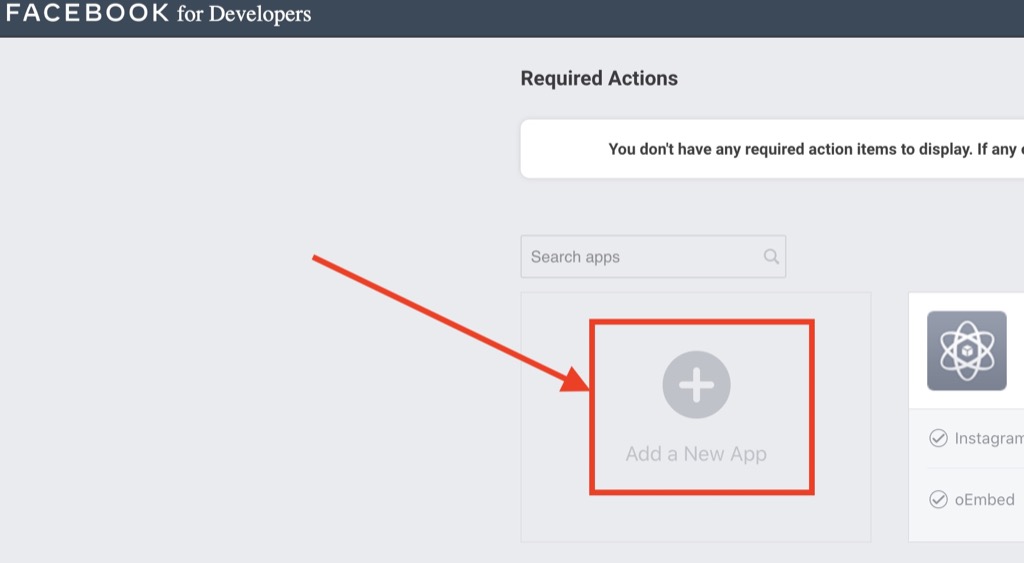
Create new app in Facebook Developer Portal
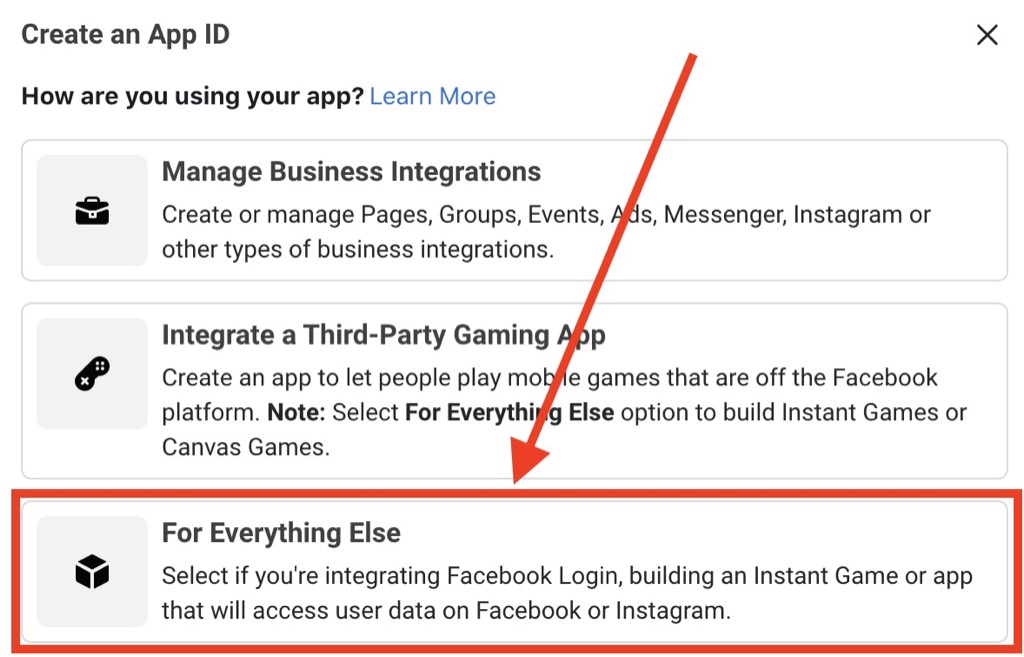
Select type of app to register
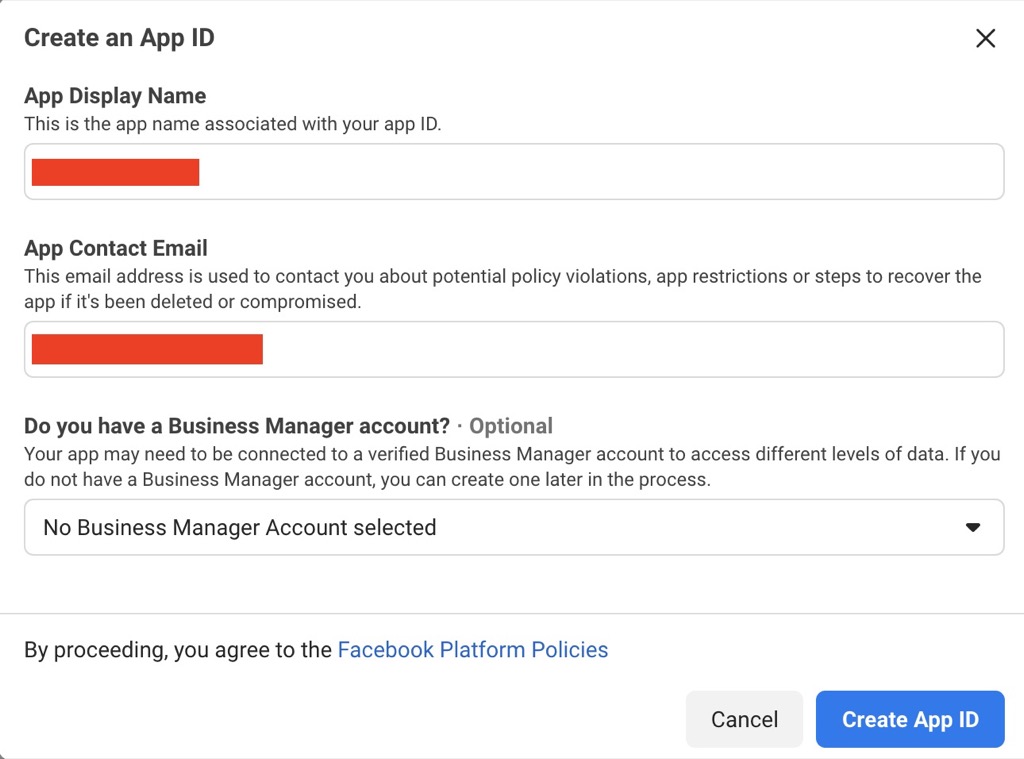
Provide details for the app
- Once in the app you need to add the
oEmbedproduct to it. From the list of products select it and click on ‘Set Up’, you will see screen on the right picture below

Select oEmbed Product
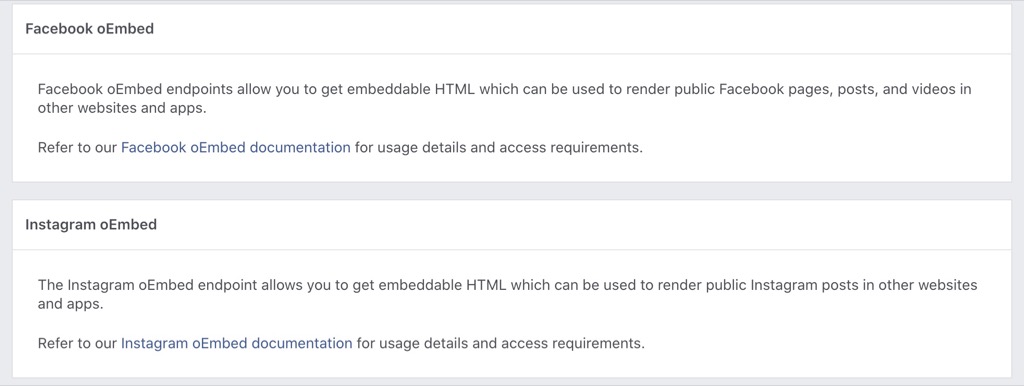
oEmbed Product added
- Go back to the app dashboard (Dashboard button on the left), you’ll see the application stats already
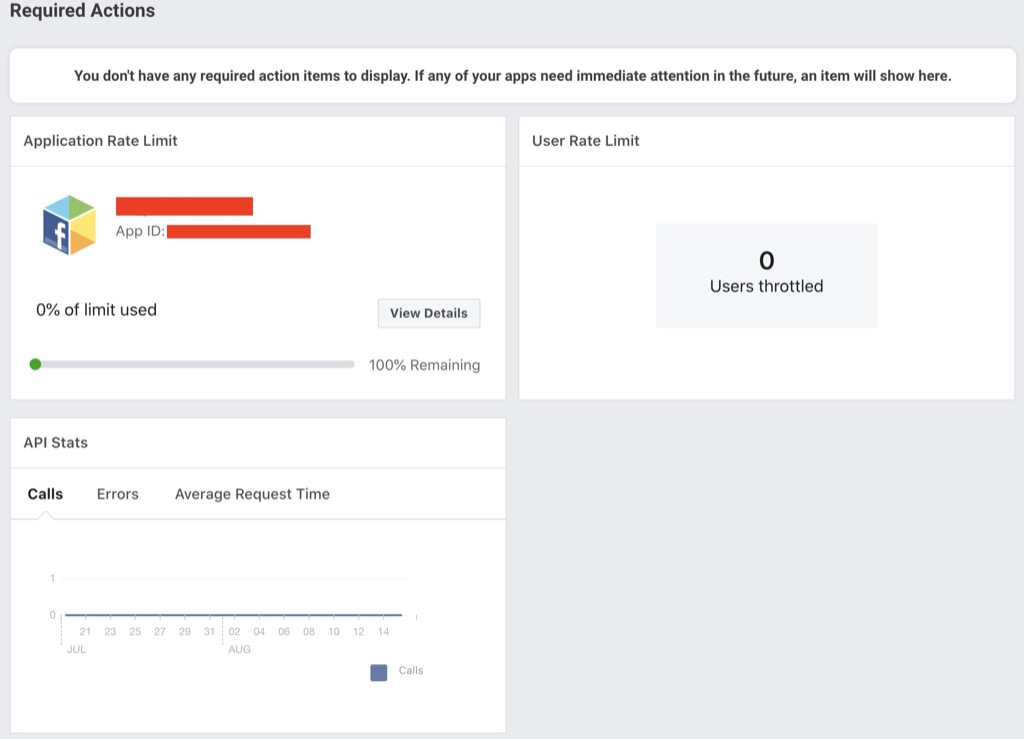
App Dashboard
- The only thing left is to do here is to move your app from
DevelopmenttoLive. When you try to turn on Live mode you might get alerts for additional actions to take, simply take those actions

Turn on Live mode

Live mode is enabled
- Now we need two fields in order to start making
oEmbedAPI calls. One of them is theApp IDwhich you can get next to theLivebutton.Client Tokencan be viewed by going to the menu on the leftSettings -> Advanced
Using Instagram API
With the information we need we can proceed and create a library that will do the work when we need to. Then I will give out the details for invoking this library from within Hugo framework , if you use a different site you can skip those details however it should be quite straightforward at that point to use it. This library is quite simple, it exposes a method for parsing the Instagram ID from the query parameters and another one for querying the Instagram API and getting the HTML fragment needed for rendering the post. This library is written in TypeScript and transpiled, it uses its own namespace to avoid mixing with other JavaScript pieces from the page. It can be used to embed well known Instagram post ids (not just at runtime). This library takes a selector of an existing place in the website’s page and replaces it with the embedded Instagram post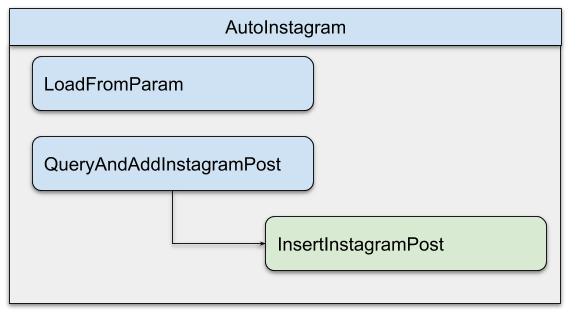
Auto Instagram Library
To use it:
- Update
AutoInstagram.LocalConstants.AppTokwith your Application Token andAutoInstagram.LocalConstants.CliTokwith your Application Client Token previously retrieved - Build Auto Instagram library
- Add Instagram’s embed library to your website or post:
<script type='text/javascript' src="//www.instagram.com/embed.js" ></script>- Add your built library to your website or post as reference
- In your post you can get the Instagram post id when passed via URL in the form of the query parameter as follows:
?insta=<postId>. To retrieve<postId>make the following call: window.AutoInstagram.Control.LoadFromParam()- In its current form you can replace any paragraph
<p>with the given text inside for the library to replace it with the actual Instagram post. Internally a selector is built to find the node and replace the code. Example: The given paragraph<p>Insert-Instagram-Here</p>will be replaced with the Instagram post by making the following library call: window.AutoInstagram.Control.QueryAndAddInstagramPost('<postId>', 'Insert-Instagram-Here');- Obviously you can modify the library to use other selectors if you want
You can view the library contents in this Gist
Is pretty simple as you can see 😉
Integrating Our Library with Hugo
Ok so we know how to make API calls to embed Instagram posts into a web page. Later we will use this feature just added to our website in order to have our Tableau dashboard embed our website elements rather than Instagram directly. I personally I end up embedding the Tableau Viz back on my website in the following way:
Embedding Components a la Inception
The following details outline how I managed to create a place for a “special” post whose only content or job will be to display whatever Instagram post is indicated via query parameters at runtime (notice that Hugo already provides a shortcode that allows you to embed Instagram posts however the specific IDs have to be known before building your site while we need them to update the posts while already deployed). Since this post will be embedded in our Tableau Viz and we can’t get rid of the Instagram’s shell we will need to save as much real estate as possible for the actual picture to be displayed. Therefore this post needs to hide all UI elements that are part of the standard posts (navigation header at the top, title, sharing buttons, discussion plugin, footer, etcetera). Notice that I’m using the Ananke Theme that is suggested by default by Hugo's setup guide . I created a local copy and modified the following theme files to allow hiding all the UI pieces at will

baseof.html - Allows to hide footer
The remaining change is done in single.html and for the sake of simplicity you can view it
here
. Now we have
the option of hiding the UI pieces, for the special post we create a simple post without photo header
and we simply add the option barePage: true to the front matter. We need to create a
shortcode that allows to connect our post with the library we added in the previous section. This
shortcode will take two parameters: the first one to indicate whether to parse the
Instagram’s post from query parameters and the second to locate the contents of the paragraph used
for the selector to replace with the actual post’s content
Shortcode to connect posts with our Instagram library
Finally we call this shortcode from our special post, this is how it looks like:
You can see it running on
this post
. You can add ?insta=<postId>
to the URL to load custom posts, feel free to give it a try. If you want help getting
Instagram post IDs
I built a post
to help you extract those IDs and visualize them loaded, feel free to
check it out as well. Also if you don’t want to build all of this for yourself feel free to take
my special post
for your own Tableau Vizzes, again you can
get help from this
Brewing Cats' post
. Finally you can see the code working here:
Instagram-Embed-Working-Here
Creating Our Data Source
Finally we have all we need to start working on our Tableau Viz. In this section I’ll
detail how I put together the data to be consumed by the Tableau Viz. You have many options in
regards to the format of the source .txt, .csv, .xlsx, locally. I decided to use
Google Sheets
because it is very convenient
and easy
to update. Connecting to either of these data sources is actually pretty simple. I’ve organized the
data that we already collected in the following columns in the spreadsheet:
- Latitude
- Longitude
- Title/Description of the photo/group of photos
- Date of the photo/group of photos
- URL of the photos. For this post I’m using Instagram IDs since our shortcode already assembles the full URL (you can get the post IDs from here )

Google Sheets Sample
Handling Embedded Sizing
Once you have hosting figured out. If you decided to host a raw picture, adding it directly into Tableau will not resize it to the available space and you will end up with a huge image that won’t fit into the given Tableau container. For that we need to wrap it in a container that will not grow beyond the given space a.k.a the Tableau container. This website has a way to do it (your image needs to be able to be loaded from this domain for it to work). Below there’s an encoded that will take your image source and an updated URL that will resize to the available space. Give it a try
Creating the Viz
Open Tableau Public app on your desktop and connect to you data source. Then select the right table and go to Sheet 1
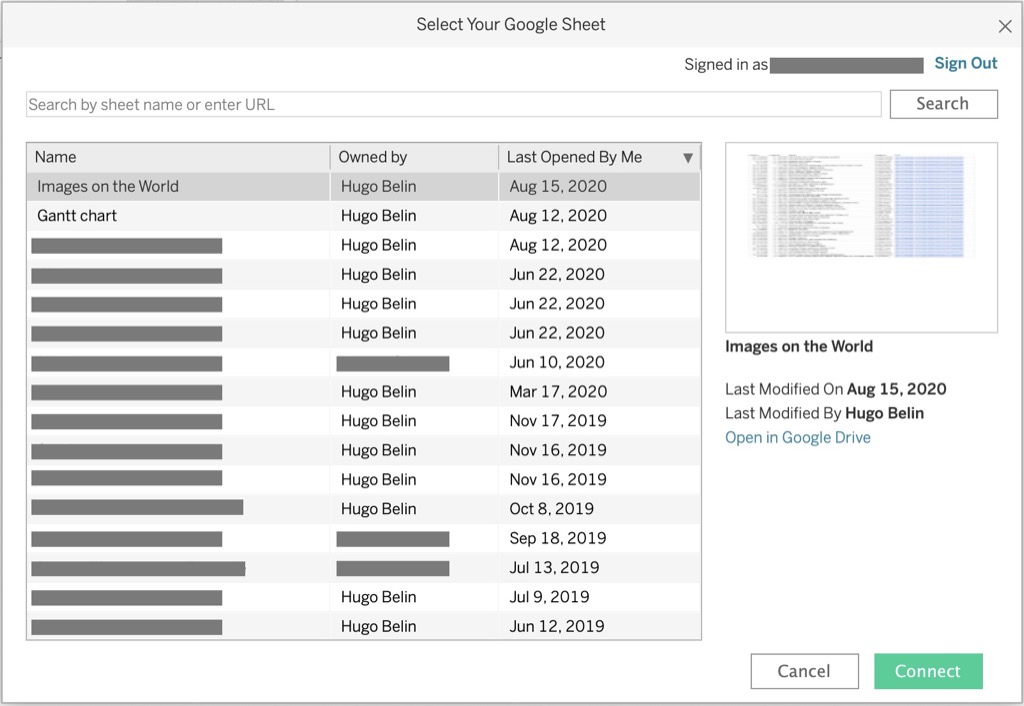
Connecting to Google Sheets
On the worksheet drag Longitude pill over to the Columns shelf, then drag Latitude pill over to the Rows shelf. Make sure both pills on the shelves are set to Dimensions and Continuous.
If the Viz area is not set to a map you can set it manually to be a map, just go to Marks shelf, and from the Automatic dropdown change it to be Map
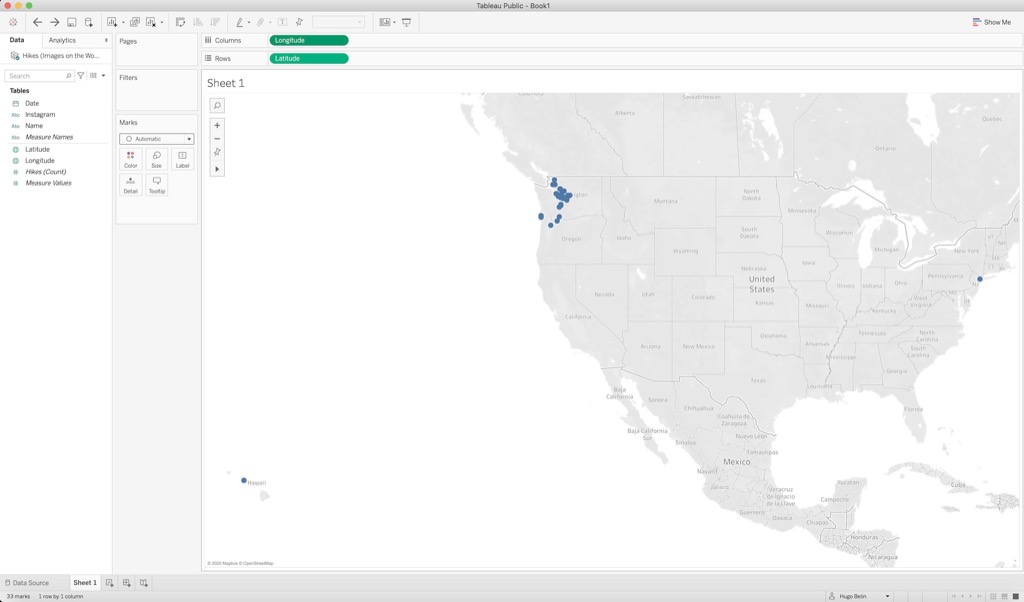
Map built using Latitude and Longitude
We will need the remaining fields to create actions and other data, drag the following fields into the Detail button under Marks shelf: Name, Instagram, and Date, for Date after
dropping the pill I changed it to Exact Date and Continuous. To add some color drag Date pill to Color button under Marks shelf, this will set the data points on the map to be
colored according to their date. I used Year as the granularity to see clearly events taken by year. Let’s name our worksheet Map
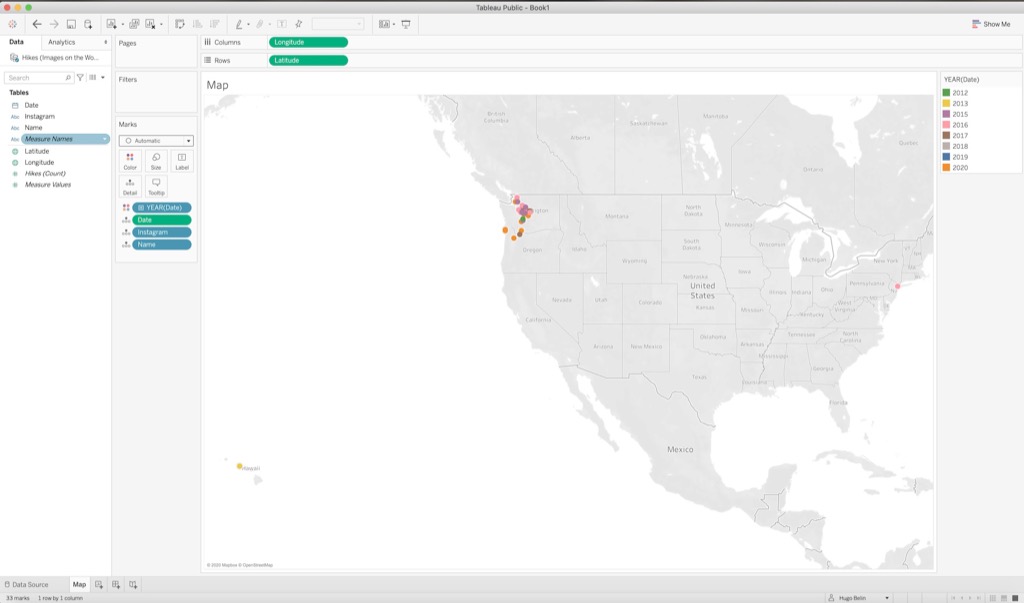
Remaining Pills added to Map
We’ll be adding a label for the Name and the Date for our dashboard but these will be different worksheets. Let’s create a worksheet named Date and drag Date pill to Text button on
the Marks shelf (again use Exact Date and Continuous). Drag Instagram, Latitude, and Longitude pills into the Details button on the Marks shelf to bring it to context (make
sure Latitude and Longitude are set to Dimension and Continuous). Create another worksheet for Name and repeat the same steps
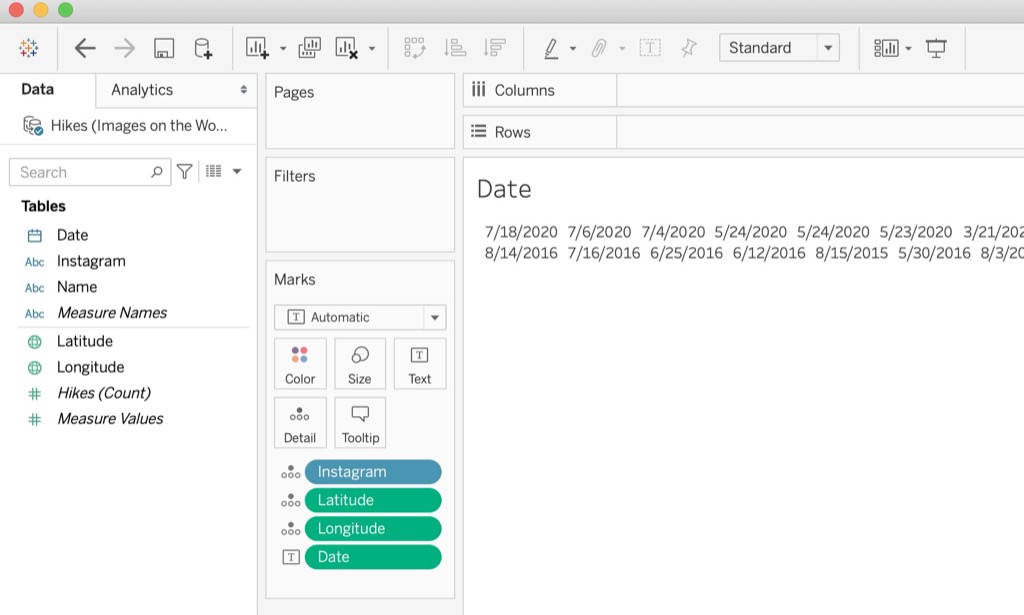
Date worksheet
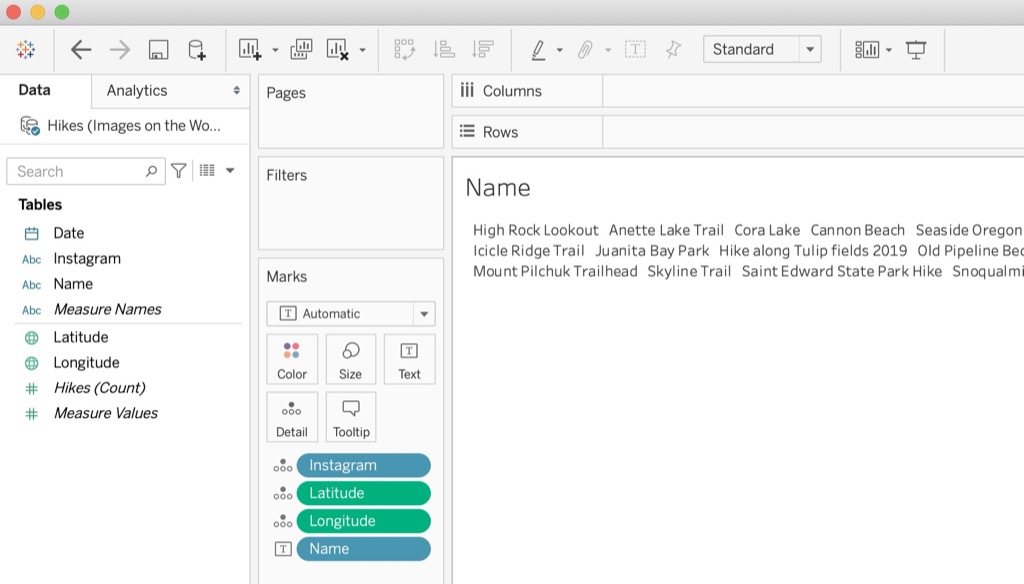
Name worksheet
Let’s create a dashboard now! Make sure you give it a relevant name since this will be the name of your resulting Viz
- Once on the dashboard, from the pane on the left that contains the list of sheets we’ve created before. Drag
Mapsheet to the dashboard area to bring the map - On the left pane adjust the
Sizeof the dashboard area (I used automatic so the dashboard can take the whole area) - On the left pane from the list of
ObjectsdragWeb Pageto the dashboard area and arrange however you like (I personally used left side for the map, right side for the web page) you can enter any URL since we’re going to update this later to show our photos - Select
Year of Datelabels and from the buttons that show up in the zone select the arrow dropdown andFloatingto optimize the space, then drag the area over to the map - On the map zone right click on the title and select
Hide Titleto optimize the space even more (is obvious that this is a map) - Drag
NameandDatesheets on the dashboard area, make themFloatingon the map area to optimize space, you can also useFit Width - Hide all sheets by right clicking on the dashboard tab then
Hide All Sheets
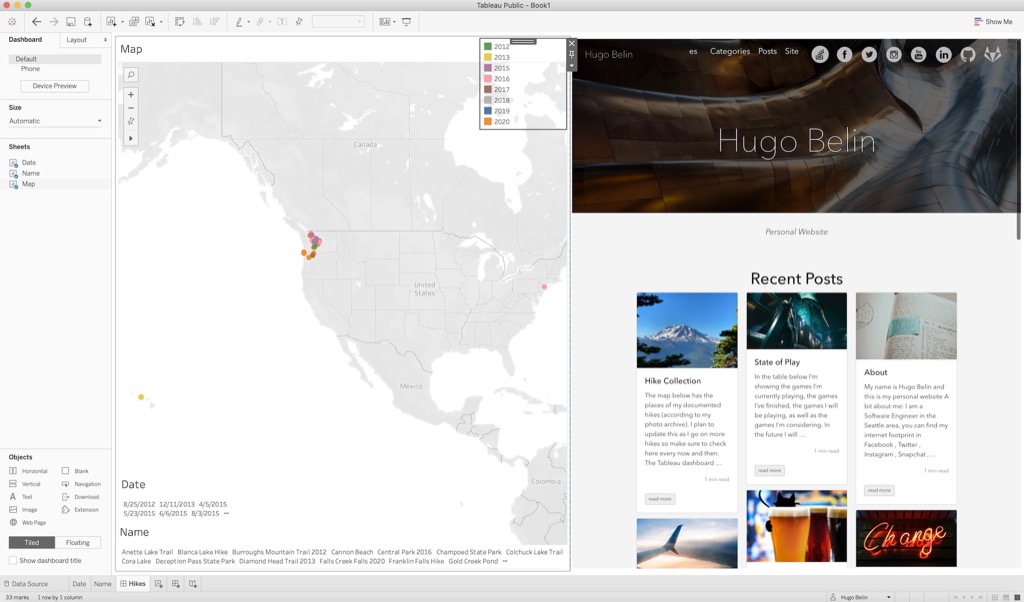
Resulting Dashboard
Lights, Camera, ... Actions!
Let’s add some actions to load our photos into the web page component. If you’re trying to add photos by URL simply use the URL field as is in the data source, for our example we’ll compose the resulting URL by adding the Instagram’s post ID as query parameter to the special post we created before which allows us to embed Instagram posts. Follow the steps on the dashboard:
Dashboardmenu ->Actions...- Click
Add Action > - Select
Go to URL... - Add a name for your action, say
View - The action should run on the dashboard we created and on
Selectaction - For the URL field you can either use the URL directly, in our case we’ll use the following URL (you can use this if you’d like too), notice that
<Instagram>is the name of the field and in your case it might be different, you can add it from the arrow on the right: https://hugobelin.com/posts/instagram/?insta=<Instagram>- For the
URL TargetselectWeb Page Objectto use the web component on the right - Click
OKand see it working. Whenever you click on a data point on the map the picture should load on theWeb Pagecomponent
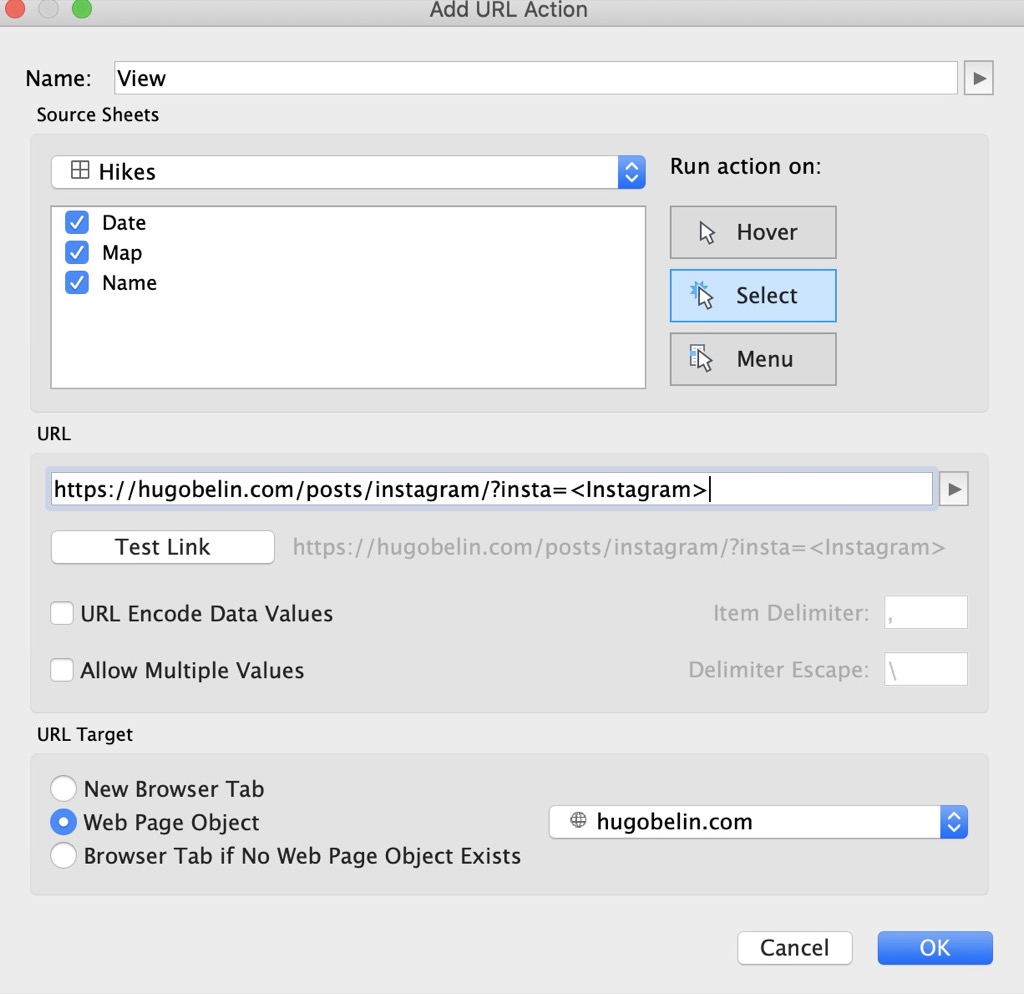
Dashboard Action to Load Our Picture
The following actions are optional but they will improve the usability on smaller screens and when embedding the Viz itself. We’ll be adding two actions, one to see the data point in Google Maps , the other to open the Instagram post on a new browser tab. For each action the following is common:
- They will be
Go To URL...actions - They will run in our current dashboard
- They will be available on
Menu(you’ll click on a data point and then a menu with the links will be shown) - Their
URL Targetwill beNew Browser Tab - We’ll name one ‘Open Location in Maps’ and the other ‘Open Instagram’
Each action will have a different URL field, for opening Google Maps:
http://www.google.com/maps/place/<Latitude>,<Longitude>
For Opening in Instagram:
https://www.instagram.com/p/<Instagram>/
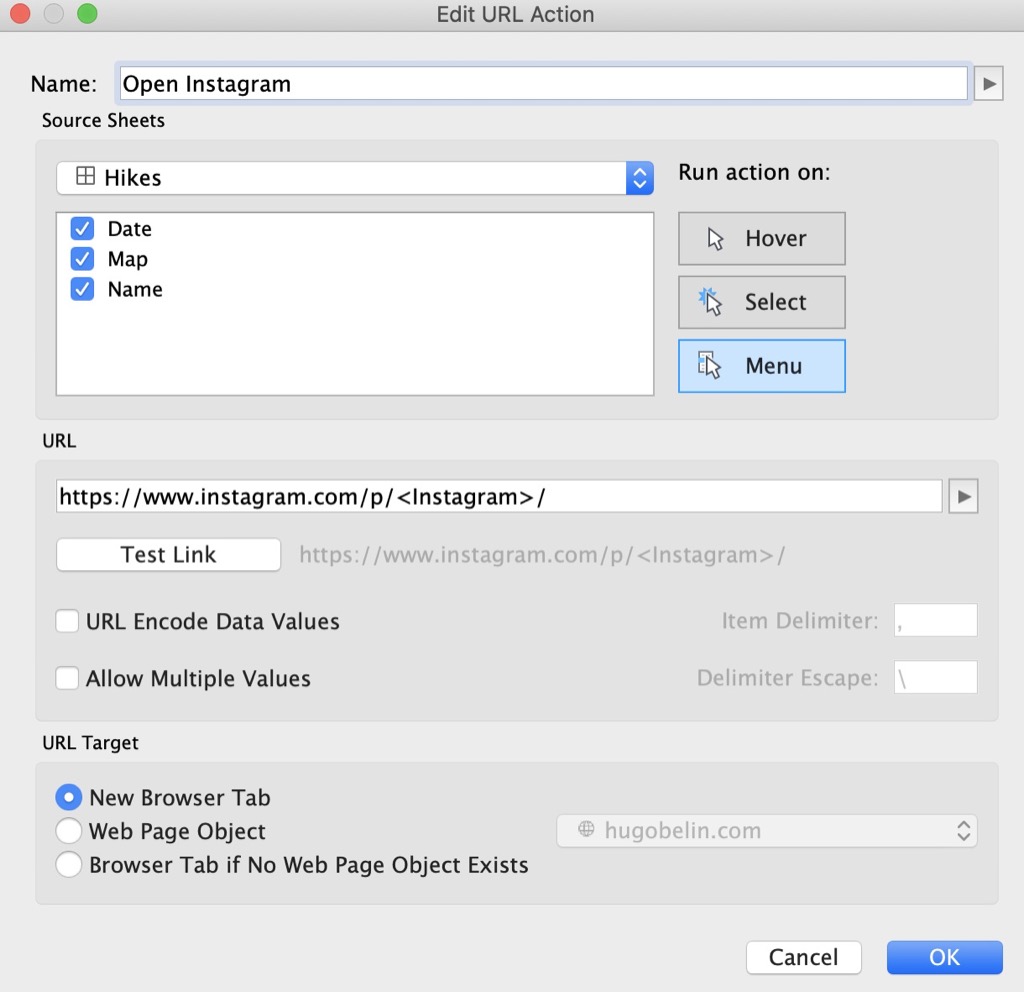
Open Instagram Action
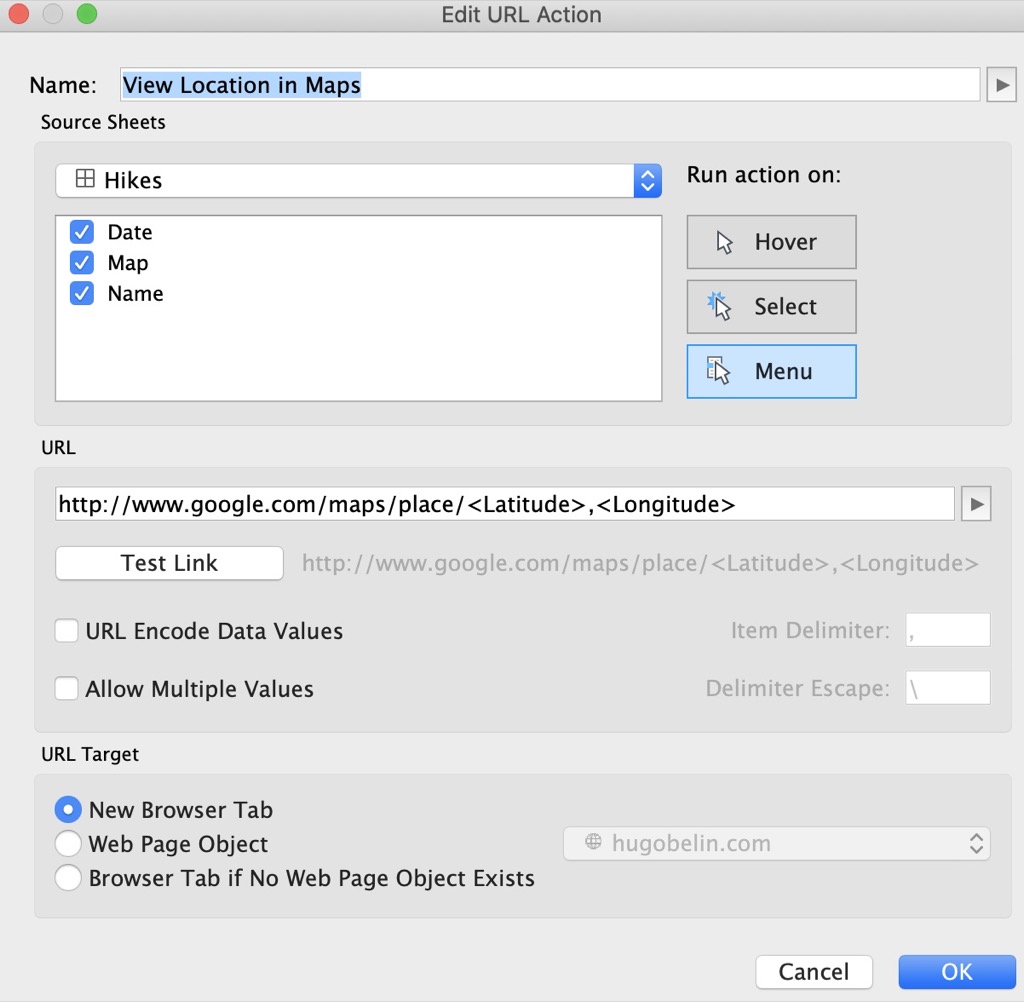
View Location in Maps Action
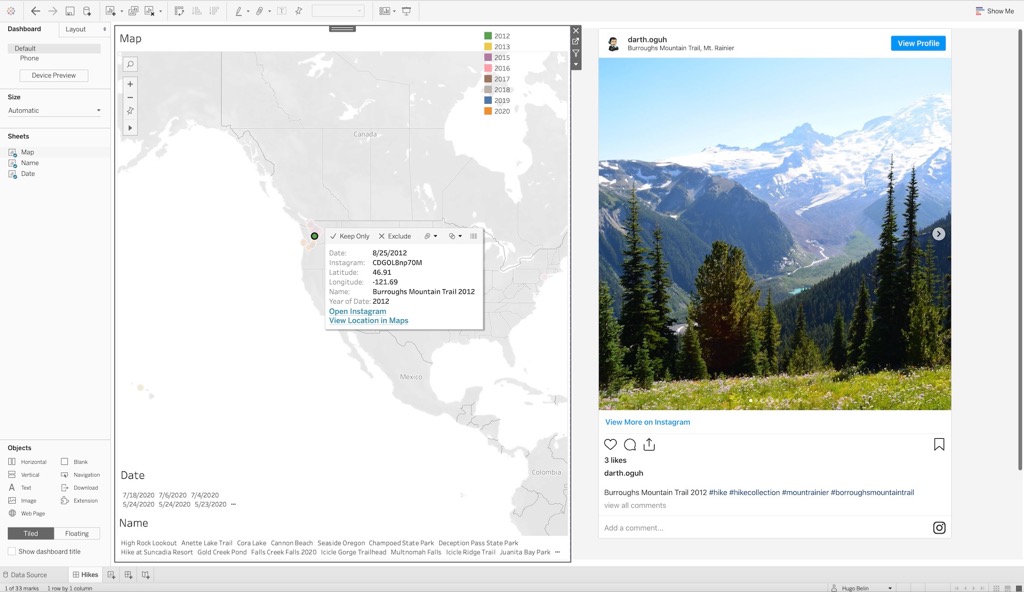
Dashboard with Actions Working
Finally we need to create a
filter action
to synchronize the data points selected in the map with our
Name and Date sheets. Select the map zone in the dashboard area and from its controls click on the Filter icon that has the tooltip Use as a Filter, after this selecting a single data
point in the map should filter all the labels (you can apply some formatting here to make the labels bigger)
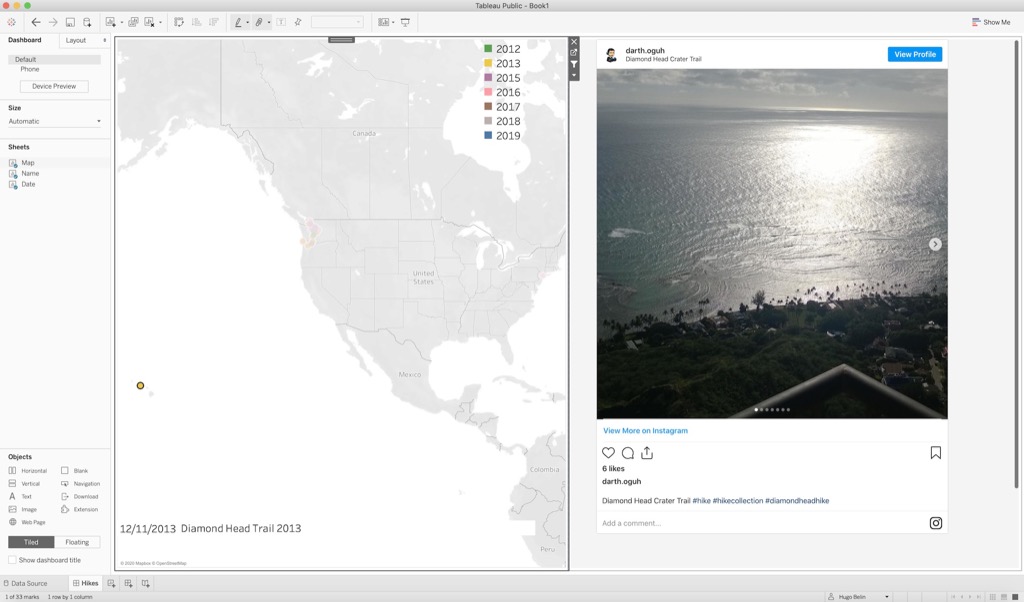
Resulting Dashboard with a single data point selected
Now we’re ready to publish our workbook and use it however we want to. As mentioned before I use it to embed them back into my website to enrich other posts. You can see below samples of embedded Vizzes using unique photos per location and grouped photos
Embedding the Resulting Viz
Technically at this point we’re done, consider this section optional. To extend the use of our published Viz I will use them to create rich experiences in my posts. In this section I’m outlining the steps I took to be able to embed Tableau vizzes in Hugo framework posts. To connect to Tableau Vizzes in our posts I’ve created a custom shortcode that takes certain parameters from the sharing code to render the Viz in the post. This is the shortcode:
From the Viz share button you have to parse (for now since I’m working on a tool to parse the fields for you) certain fields from it in order to feed them to the shortcode. For example for
my hikes Viz
when clicking on the Share icon from the bottom right you get a text field with the
embed code, from them I get the fields on the second picture below
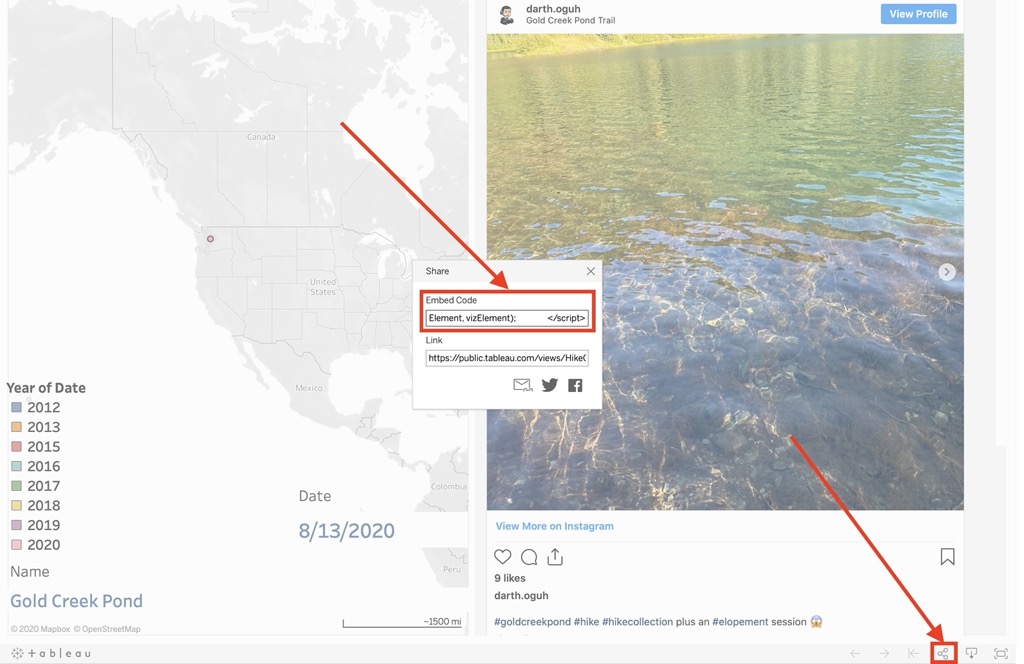
How to get the code for embedding a Viz

Fields from the share code needed for our shortcut
Then I call my shortcode as follows:
{< tableau "viz1595830498772" "Hi" "HikeCollection" "Hikes" >}
Again I’m working on automating the parsing of these fields, stay tuned for an update on Brewing Cats
You can see the embedded Vizzes down below
San Diego Viz uses single photos per location
San Diego TripHikes Collection uses grouped photos
Hike CollectionConclusion
Creating your own photo Viz not only lets you put your photos to work but it allows to share them in a more meaninful way. You can tell stories about the places in your Viz, those who were with you in the locations can surely relate better to the events that took place, and overall you offer a richer experience than simply showing your photos. Once you accomplish the setup pieces (which you can skip and leverage my loader page for it) it’s all Tableau and your photos from there
Embedding vizzes is a nice bonus because it enhances the the functionality of your site and gives you rich experiences that can only be accomplished with Tableau only. Pairing these types of embedded vizzes with a powerfull storytelling and other media will make of it a killer website. For now the vizzes that I’ve created have been used to tell about trips and to keep my photo collections but more options might come later. Having these types of vizzes also let me remove all fotos from a page making it more light and interactive (vs adding all the photos at once). Leveraging Instagram let me get good performance embeds and also gave me extra ways to drive traffic to my website by means of my profile account and the use of hashtags. Similarly my published vizzes can also capture traffic into my website so is a win-win scenario for any publisher
One observation on Tableau is that layouts do not update automatically while embedded making it not he best experience in smaller screens, however all things considered is great to have the ability to use Tableau along with your websites, showcasing your photos and enrich the web in a positive experience. I will look forward for more use cases on my website 😄