Make Your Next Presentation Pop with Tableau
By Hugo Belin
Make your next meeting pop and instead of using a boring PowerPoint presentation (nothing against PowerPoint 😅) give it a try to a Tableau dashboard! Let’s make it even more fun by adding some animations to capture your audience atention. For this example I’m going to use a Super Mario Bros style Tableau dashboard. I will show how to build one using several tools
Plan Your Presentation
The first step seems obvious but also takes some planning. You need to come up with the following items:
- An agenda for your presentation. Steps to talk about, transitions, “slides”, etc.
- A background image, best images are those that can help you tell a story, some sort of progression. Think of it as a container for the multiple stages of the presentation, you can focus on a section of the image without revealing the whole picture or display the entire picture at once (this is controlled in Tableau)
- A cursor/indicator to signal the progress of your presentation. This will point to a specific section of the map based on the progression. If you want to make use of animations, this is your chance. In this example I’m using a ‘sprite sheet’ of Mario walking 2 frames each up, down, left, right and one additional frame for ‘Course Starts’ that is used for going to a specific slide, all these are images (ideally png format)
- If you plan to use other worksheets/dashboards as slides you’ll need to add background images too
- According to the number of slides you will need entry points for those from your main map
Modeling Our Presentation
Once you collected the data from the previous section is now time to give it shape. In this section I will explain how to create the data source that will be consumed in Tableau. I’m using a Google Sheet to capture the data.
- In order to make Mario progress through the stages I’m making a counter named Step which is a simple increment. We’ll use this in the Pages shelf.
- We also need x, y columns that will position our Mario in a specific place within the map, I’ll explain how to generate this information on the next section.
- Because we’re animating our Mario to walk up, down, left, right and entering missions, we have images for all of those and we need a colum that will refer to the appropriate picture as we go through the steps, we’ll correlate this to the images using the Shapes shelf in Tableau (more details later). I named this column Index. You will need to determine the direction Mario is walking in order use the correct set of identifiers.
- We’ll need a Type field, this will be used as filter that will select the text for the slide according to its stage.
- For our “slides” we need a place for the text so I added a column named Slide Text. Each slide is tipically a title and some bullet points.
- To denote what is a title, subtitle, bullet points, etc. I’ve used a column named Text Size
Add the text of your slides under Slide Text and use numbers for the size of the text under Text Size. To differentiate slides use an identifier for each slide under Type. Gather all different sprite step pictures you plan to use and give each a name, then use the names on the Index column, in our example as Mario moves on the map I simulated it walking by alternating two images in the direction he’s walking in. I only used two frames for each direction for simplicity but you can use more according to your needs to make the transitions smoother. Below is a sample of the data source I used:
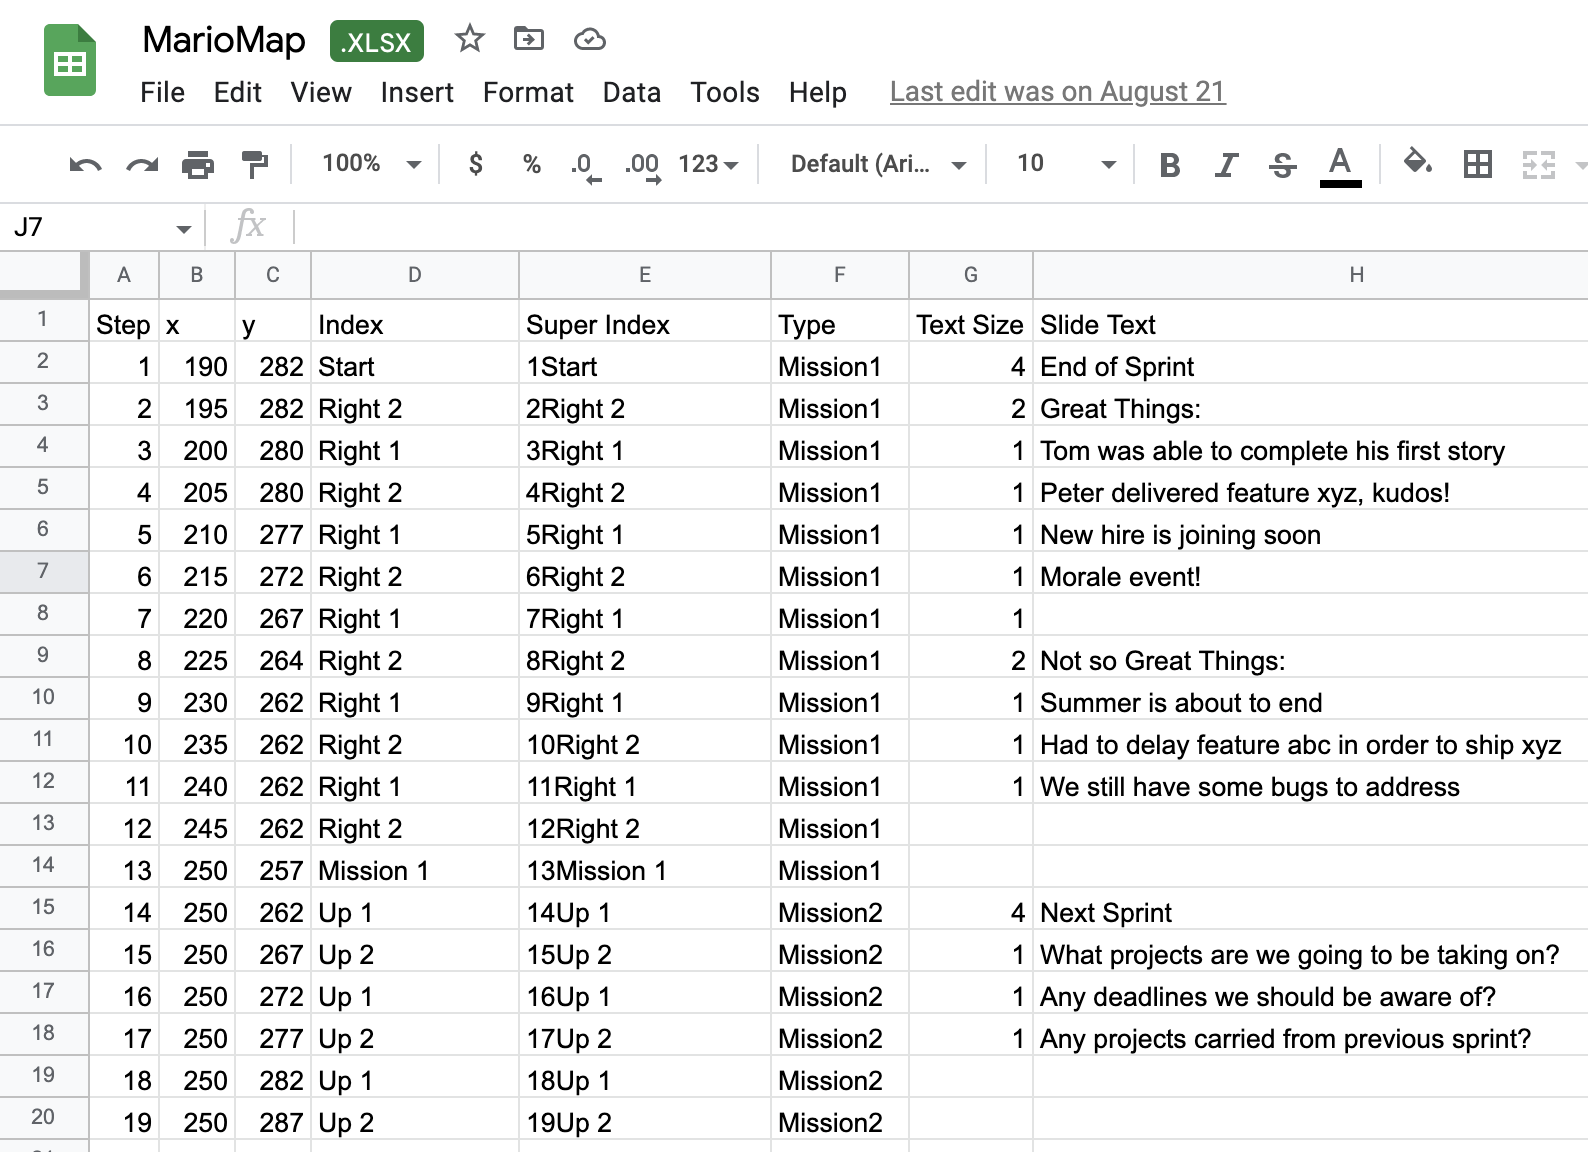
Our Sample Data Source
Tracing the Path
In our example as Mario progresses we will be unlocking slides according to the stage he’s in. In order to make Mario advance we need to design our data source in a way that we trace Mario’s desired path over a map. This requires us to enter each coordinate on top of our map. The image below shows the map we’re using:
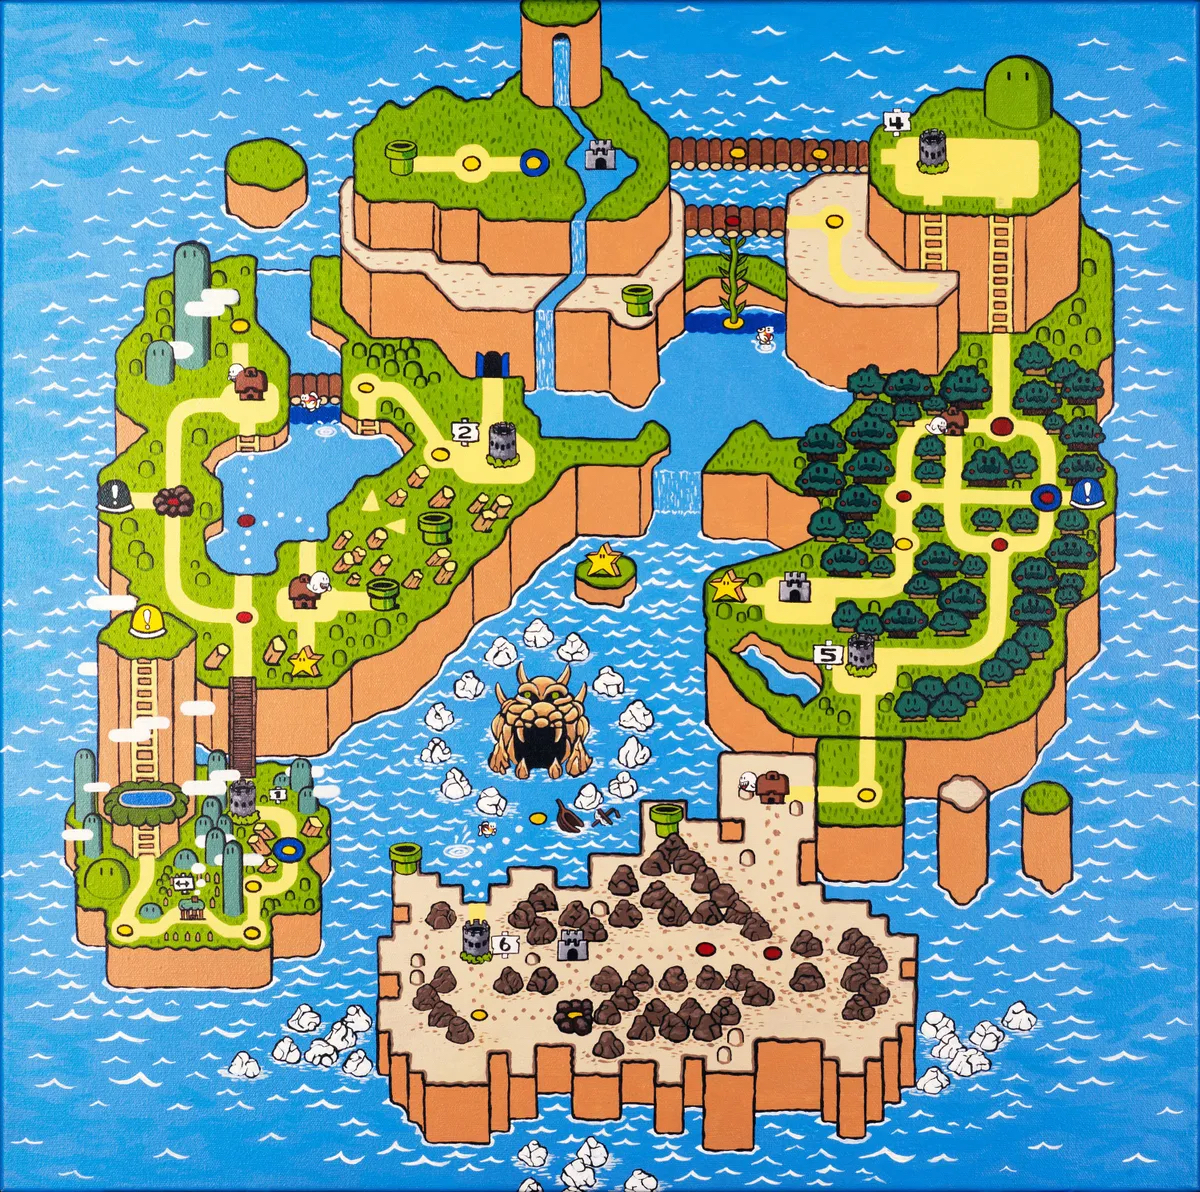
Map I'll use to move Mario over
In order to obtain the coordinates I’ve created a handy little tool in one of my side projects. Polygon Maker is a site that has a simple purpose, to draw polygons or paths on top of an image and allow you to download the list of coordinates of the generated polygon. Simply click on Choose File button, select the map image and then click on Load button as shown below:
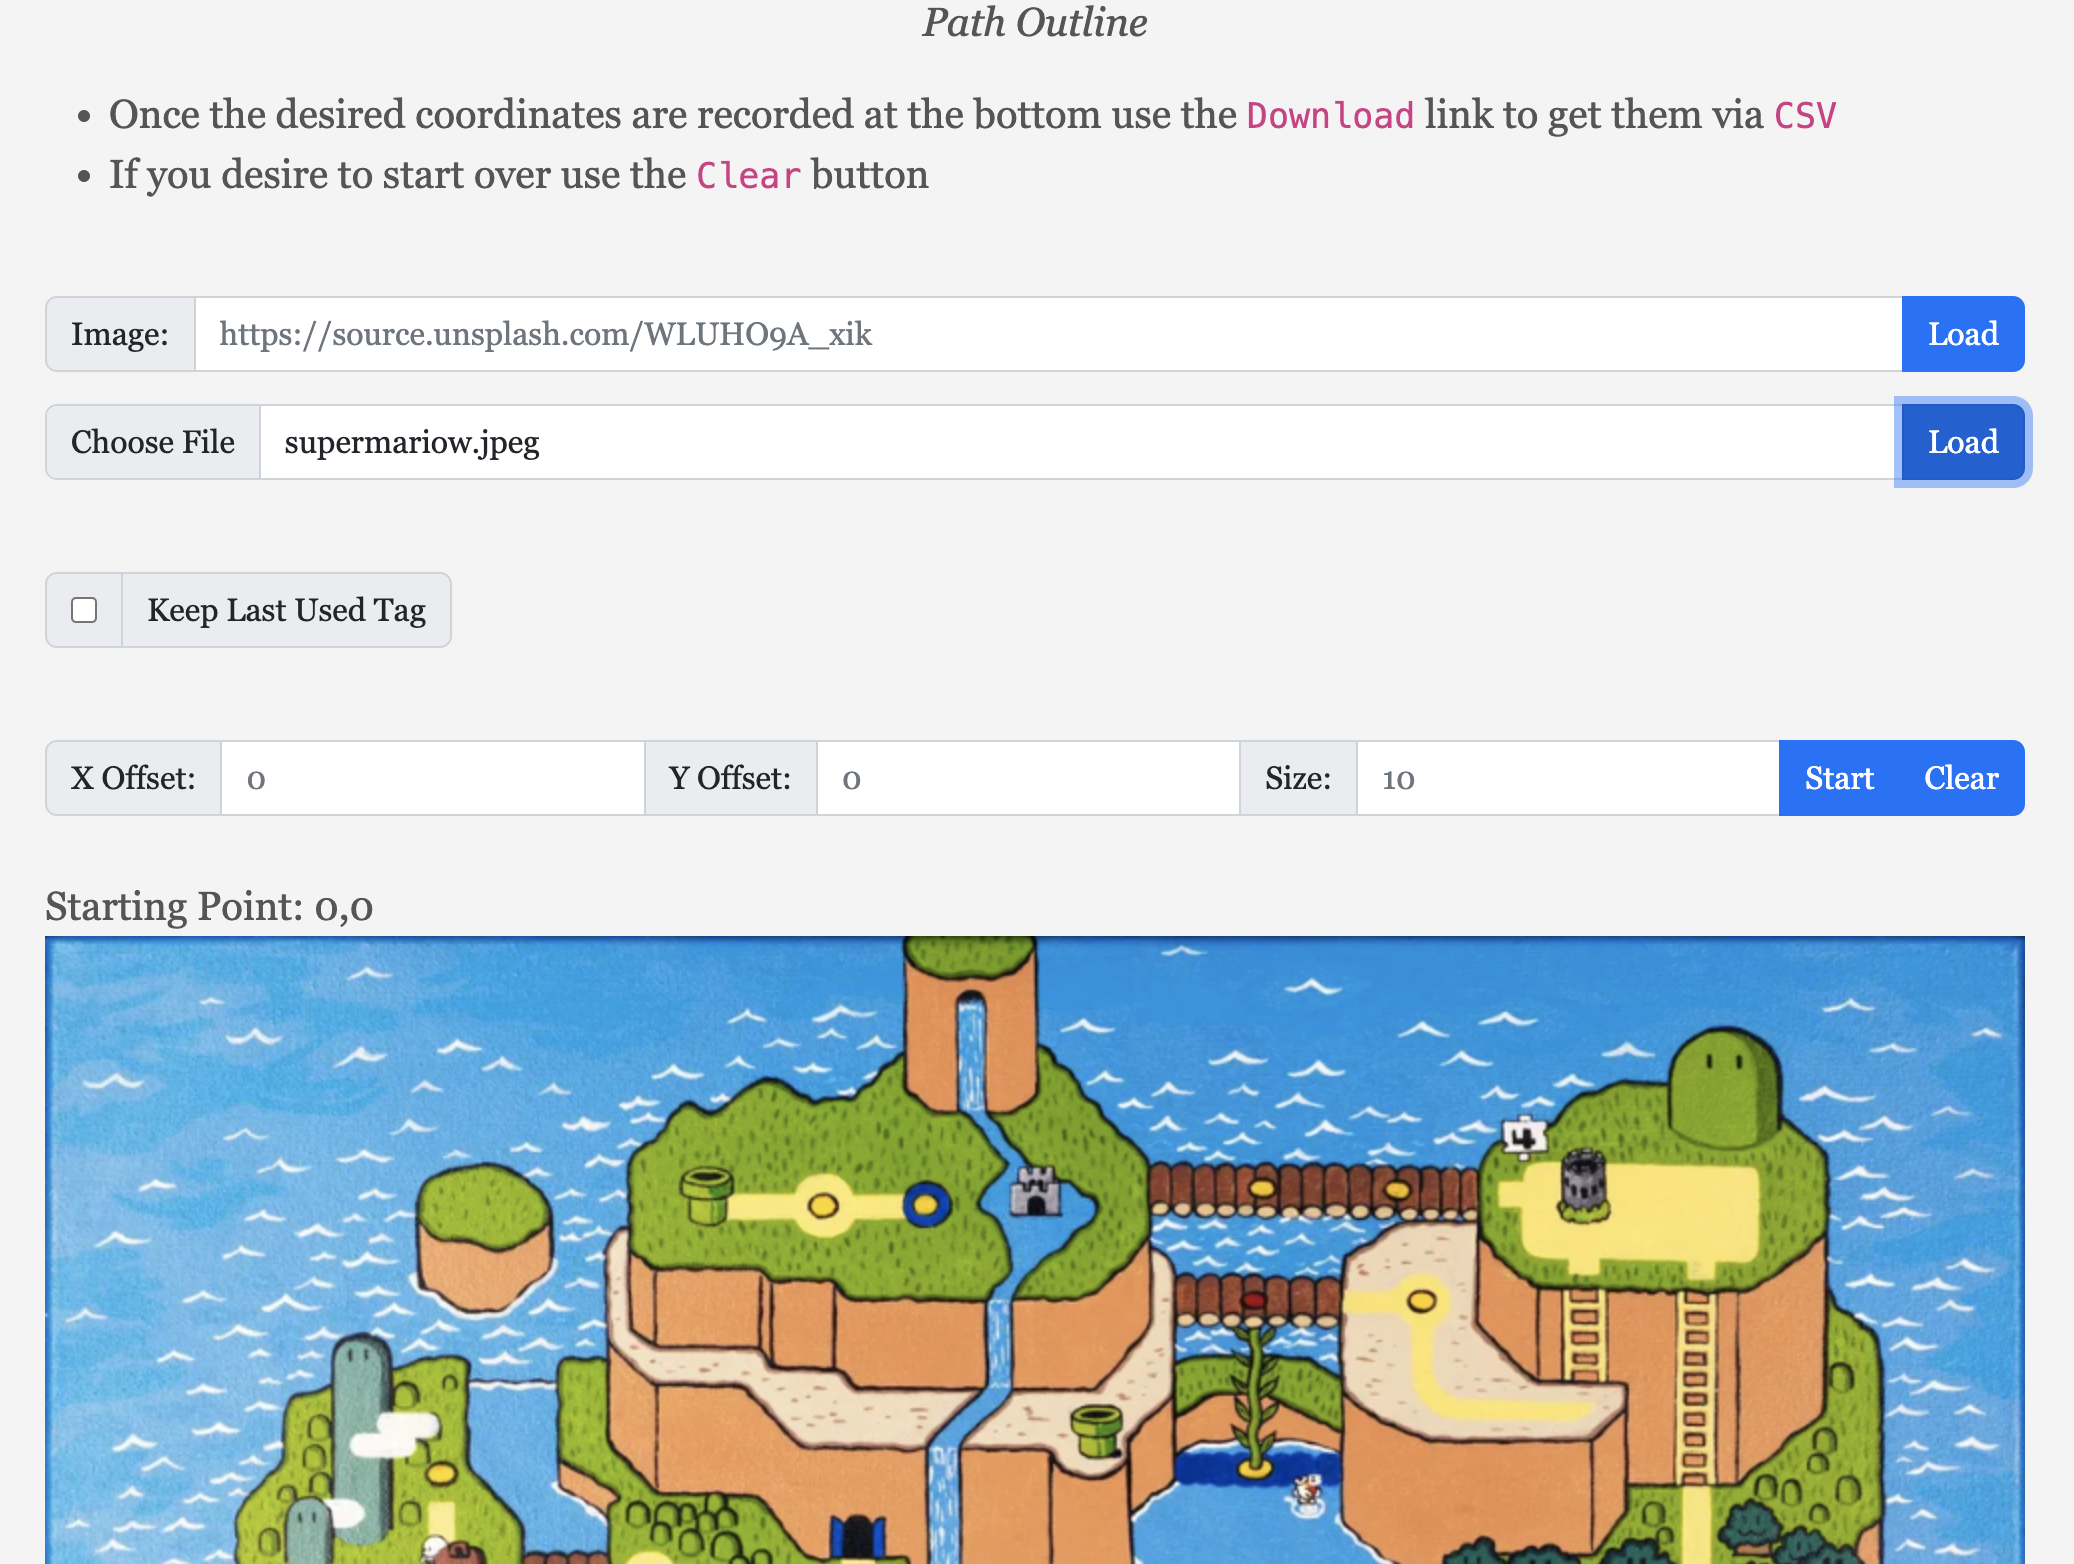
Loading Mario's Map on Polygon Maker Page
With the map loaded you can proceed to start tracing Mario’s path over the map, simply click Start button and recording will start. Clicks will be registered on top of the loaded image. Right Clicks are also recorded but they bring a context menu that allows you set tags on the following clicks, this way you can differentiate between missions making your job easier. Before start recording I recommed checking the option Keep Last Used Tag as it will keep the latest tag on the next clicks automatically. Another tip is that we’ll generate several points to simulate Mario walking but you don’t have to click on every step Mario is going to make, we simply click on the vertex of the path, that is whenever the path changes like corners and such and since we’re using a Google Sheet we can have it calculate however many points we want between two vertexes, I used a 5 pixel increment in the direction to the next vertex. With all that said, this is how I plotted Mario’s path over the image:
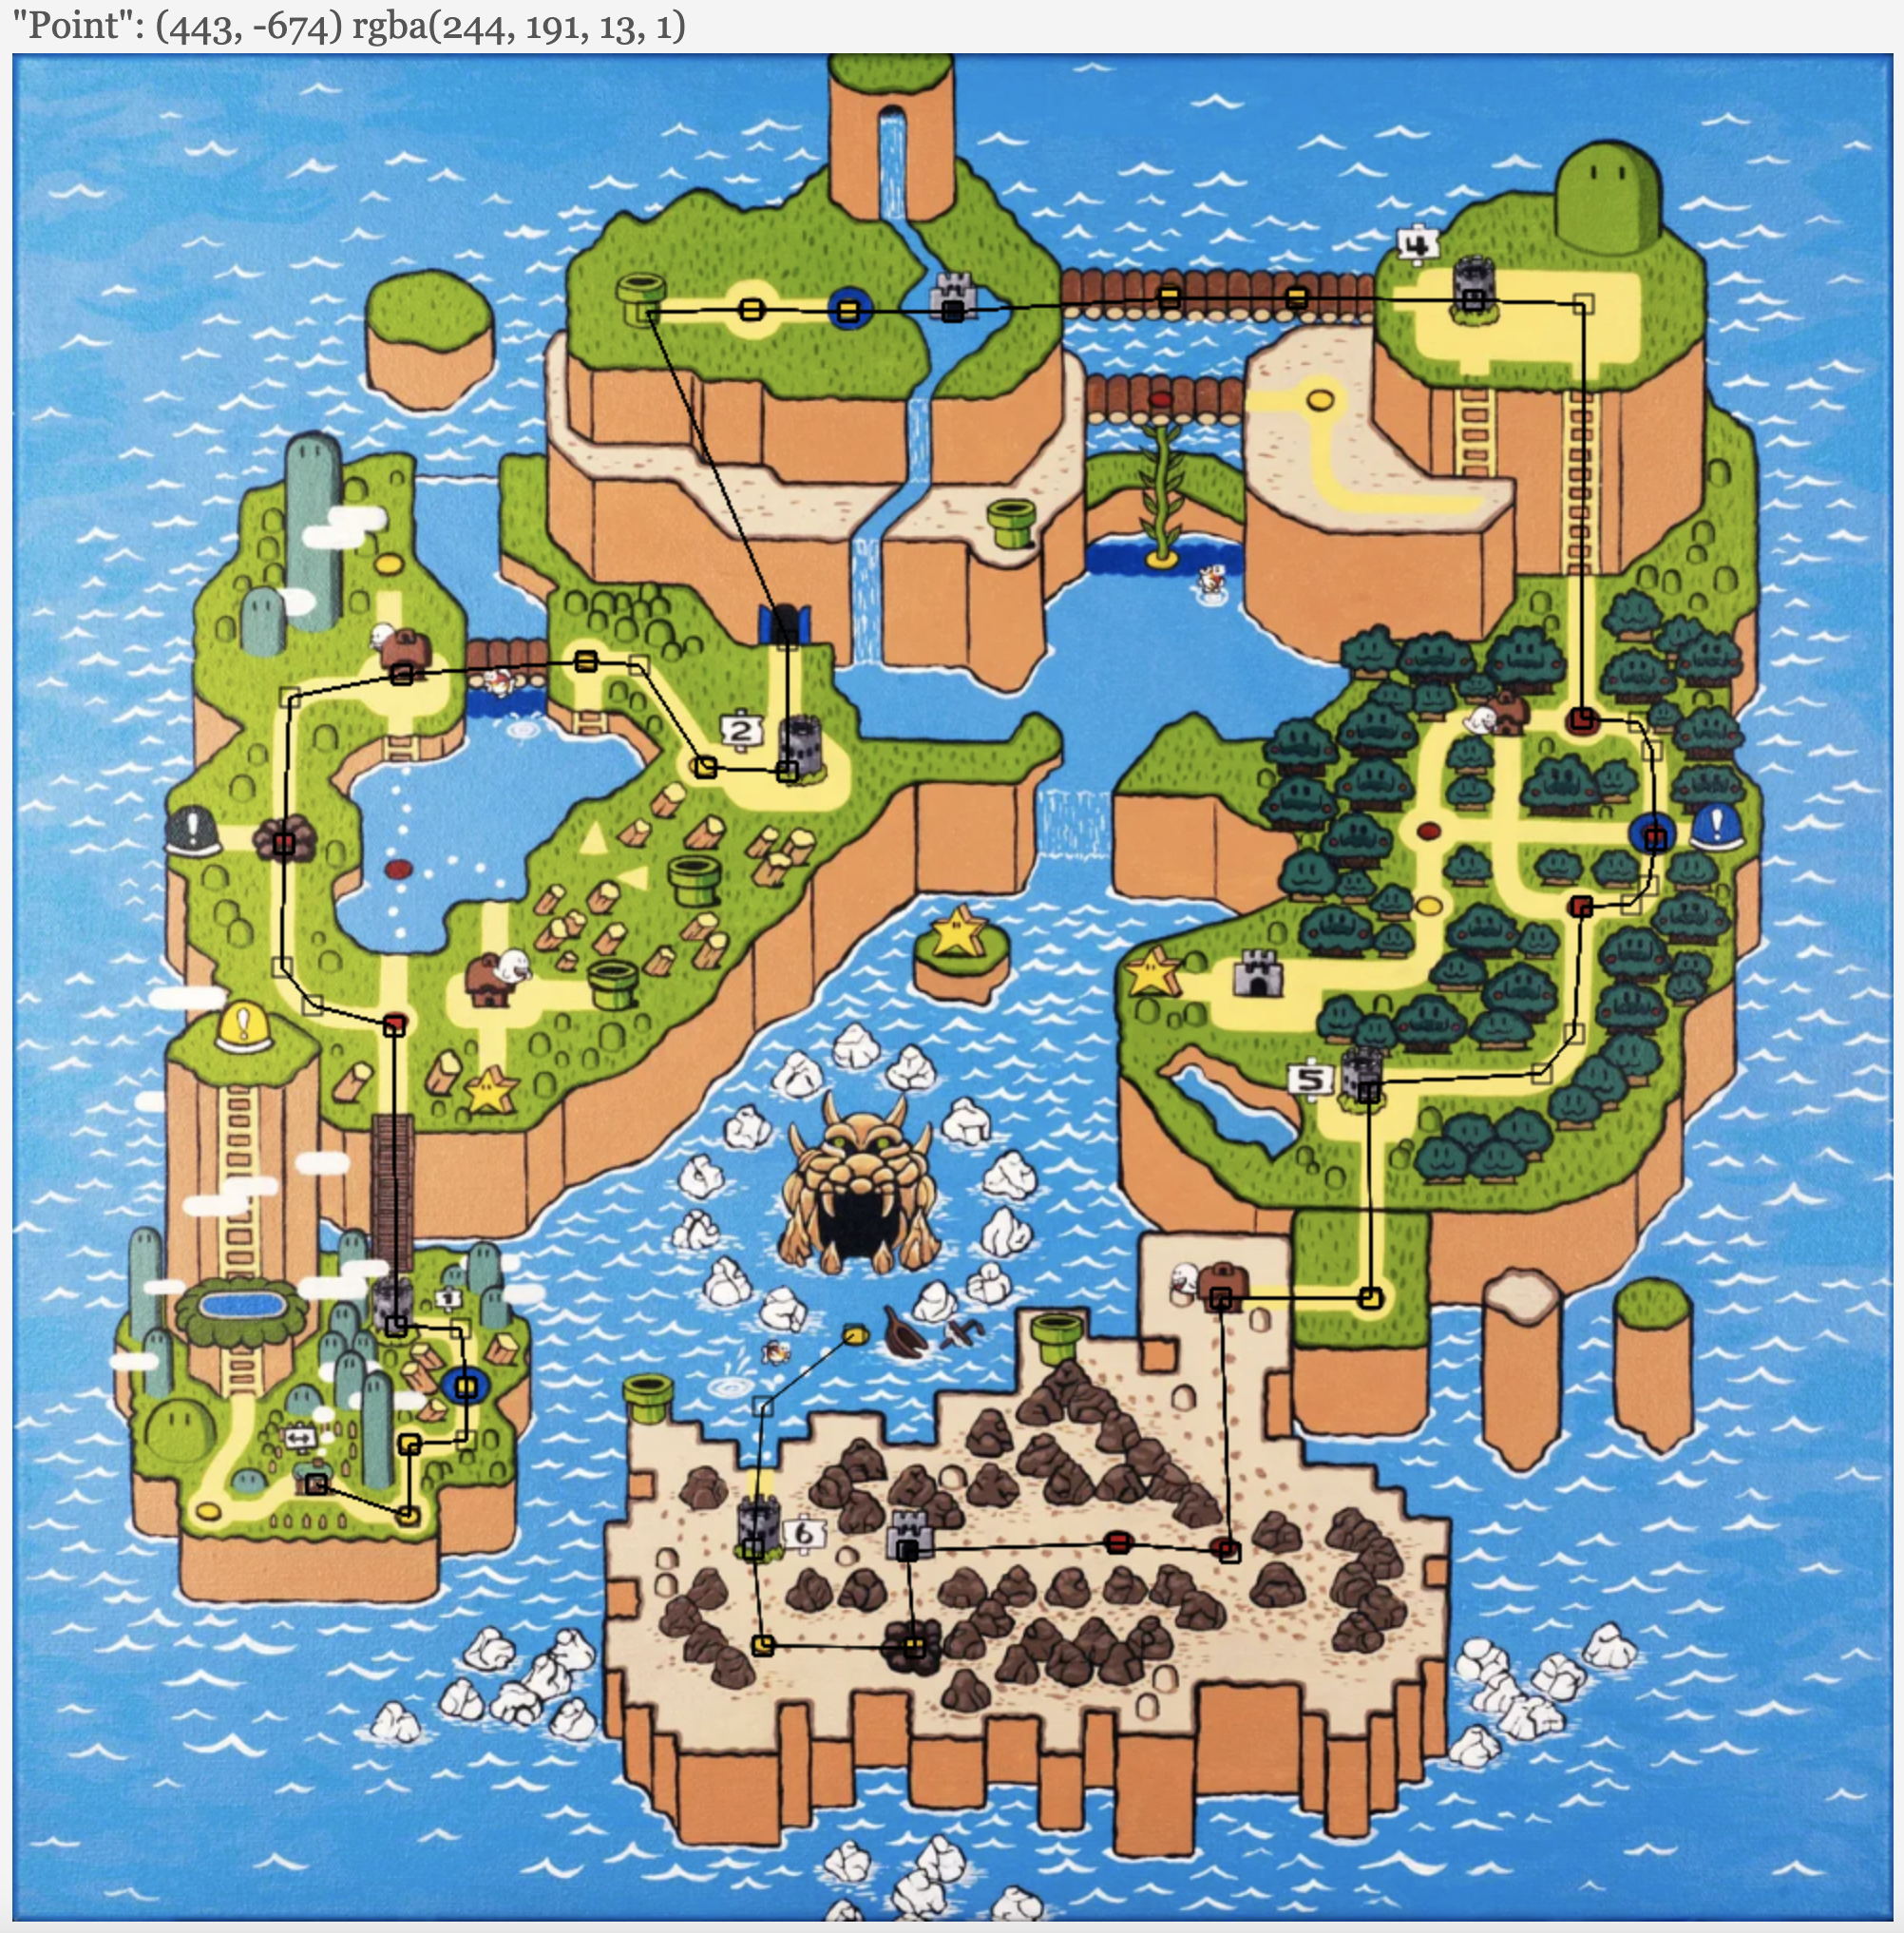
Mario's path plotter on the map
As you plotted the path you’ll notice a list of coordinates and their tags are being added to the bottom of the page and a download csv link. Once you’re done plotting the desired path you can click the download link. Match each mission with their type and have the sheet fill as many points between vertexes with a simple formula (I added 5 pixels between point). Once with this data now you can update the remaining columns to contain the type (if you used the tag feature on my site you likely saved this work) and spread the animation frames on each node. This will also give you space to enter text for the slides. Now is Tableau time!
Creating the Viz
With all the data gathered and placed in the spreadsheet now is time to open Tableau and connect to it. I decided to download an xlsx copy and reference to it locally, but you could connect to your Google Drive from Tableau, your call. After connecting to your data source drag x, y colums on to columns and rows shelves. Make sure they’re added as Continuous Dimensions as shown in the picture below. By now you should see the path we draw on top of the map from the previous step on the worksheet:
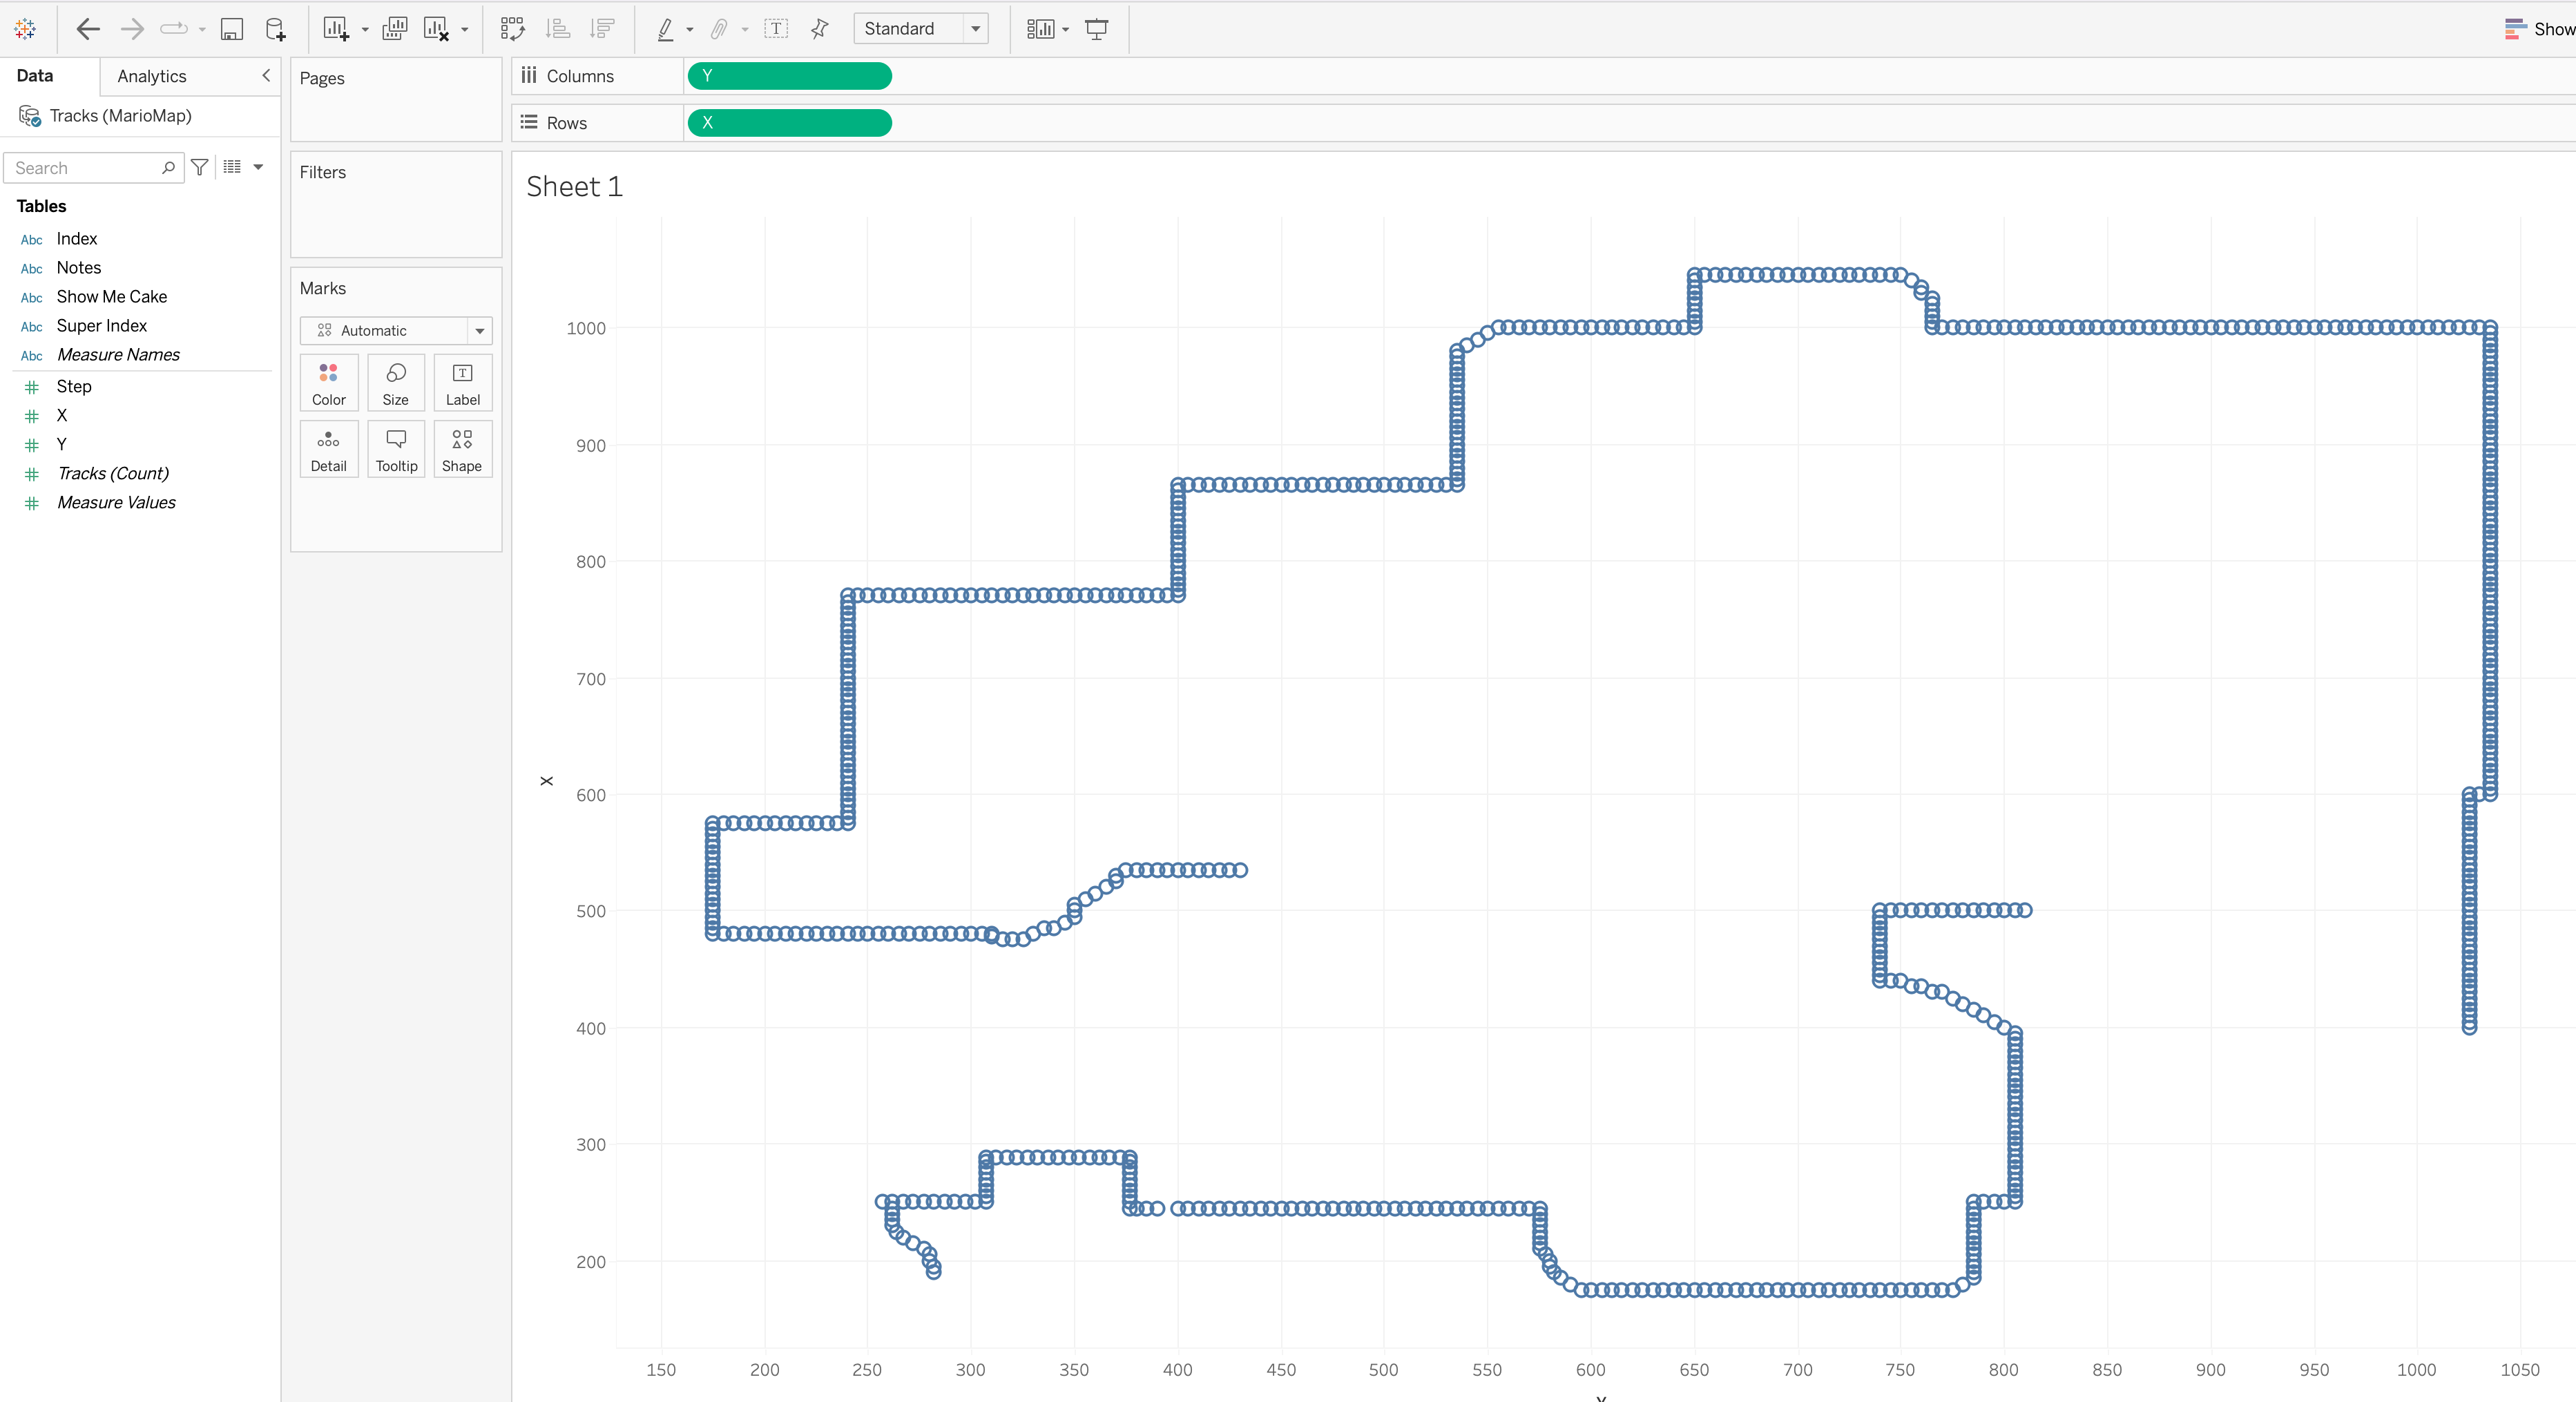
Visualization of Mario's path
Now we need take care of the map on the background. Select the option Map >> Background Images >> (Name of your data source) then click on Add Image... Enter the path of your background image (in our case Mario’s map) and enter the dimensions on the selected fields as shown below:
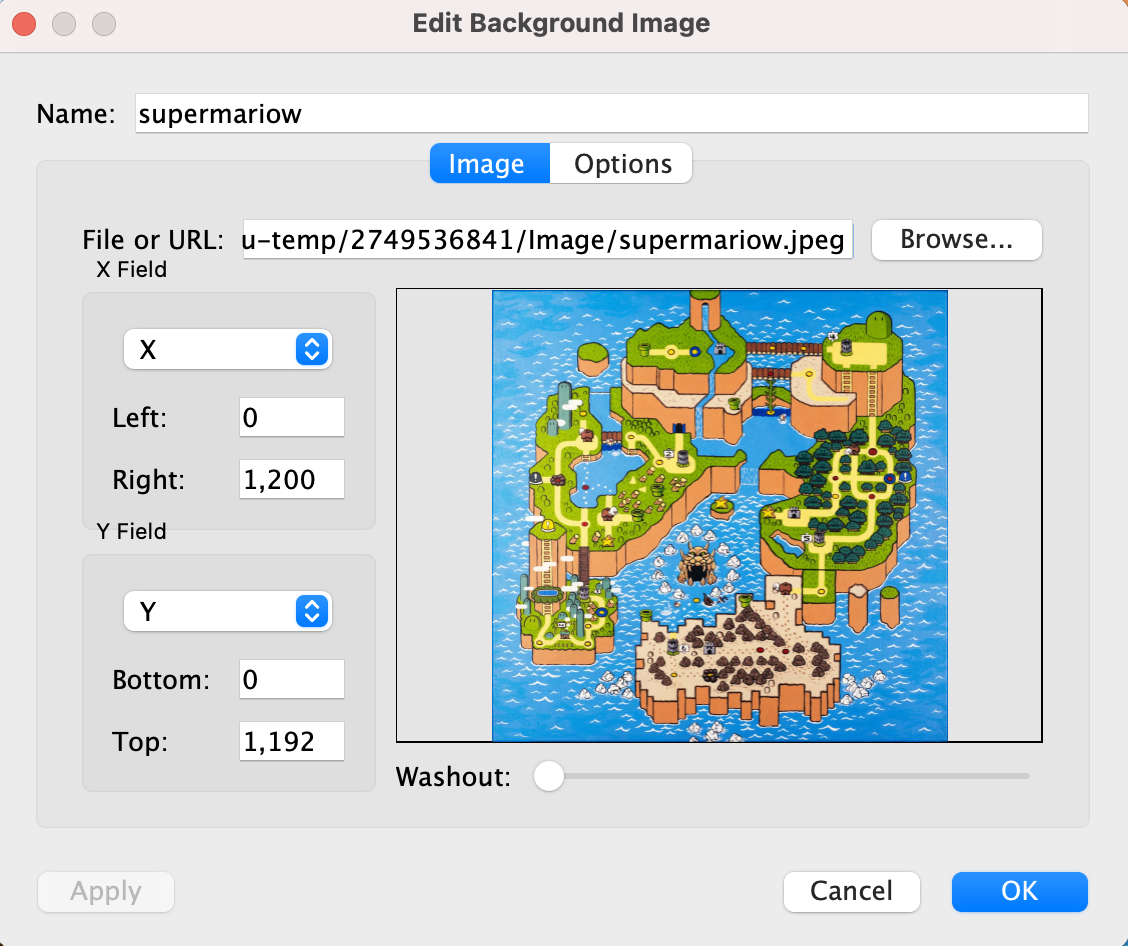
Mario's backround map
By now you should see the path of Mario on top of the map as shown below.
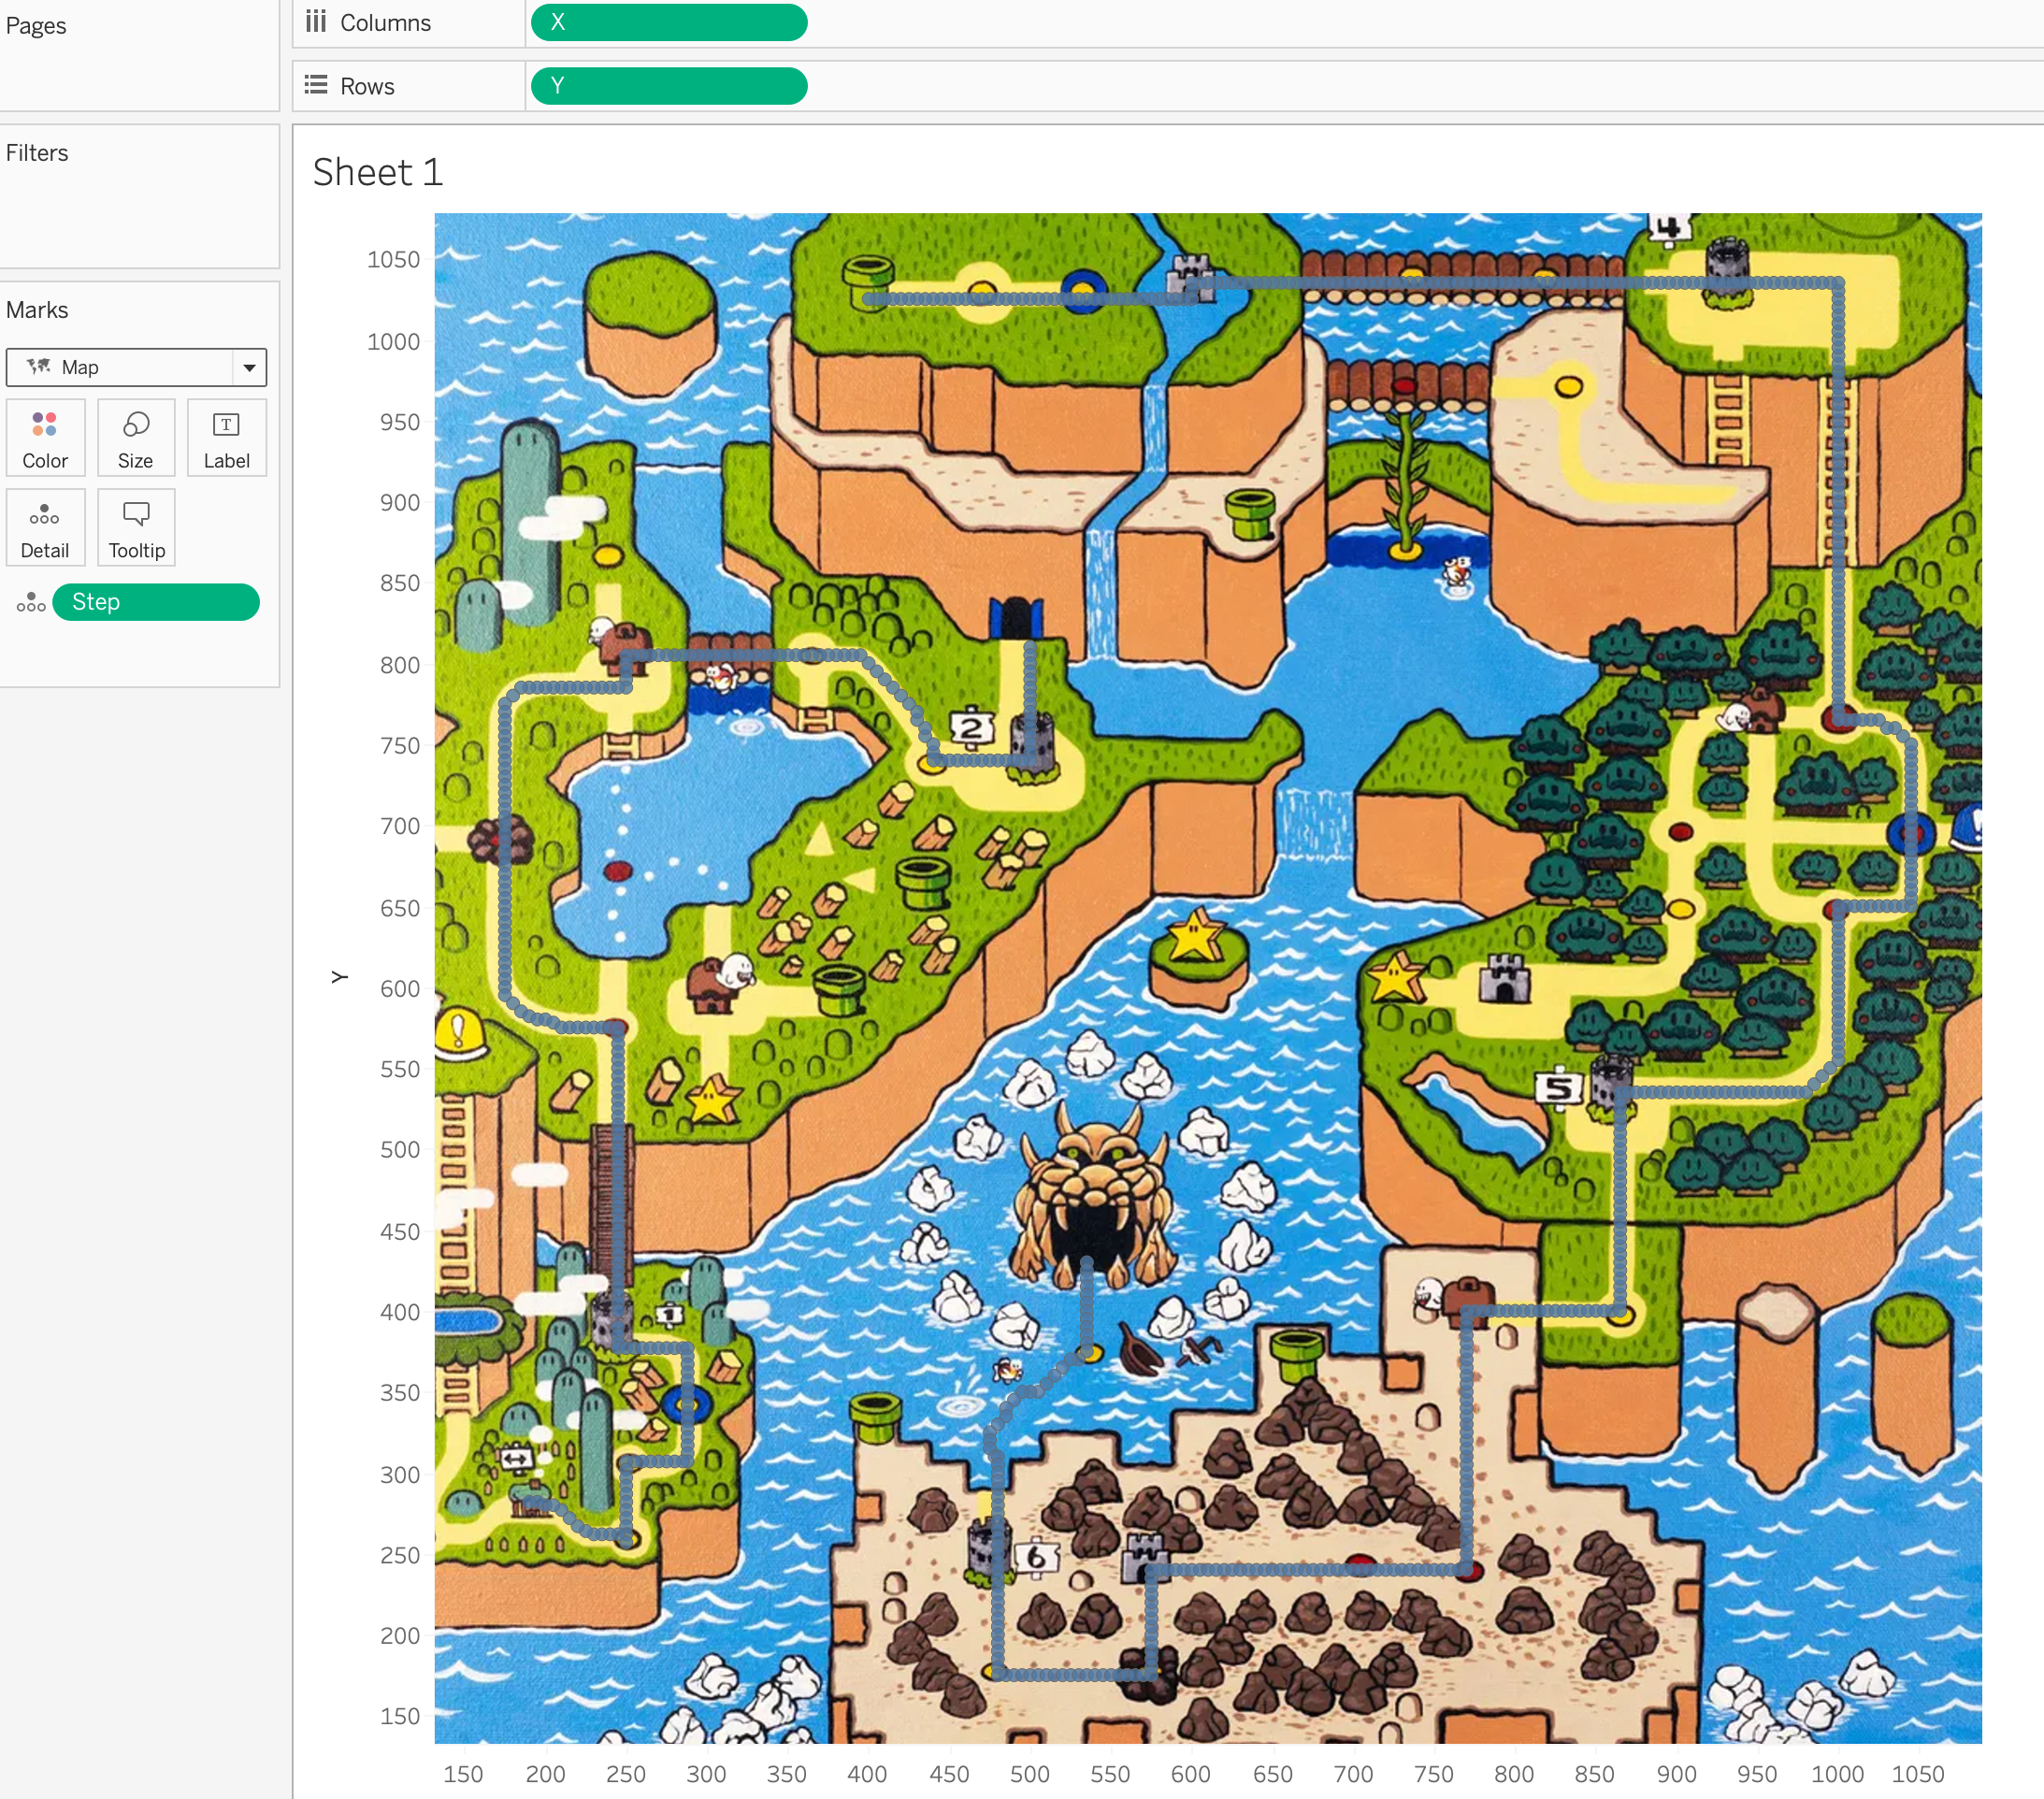
Mario's path on the map
Next we need to add the ‘Step’ column (the incremental counter we mentioned before) to the Pages Shelf, make sure the control is displayed, we’ll use this control to enable Mario to move on the map. To animate Mario while he moves on the map I’ll use the Index column that contains different identifiers according to the movements of Mario. Take all the images of Mario (or your desired character ideally in PNG format) and place them all under Documents/My Tableau Repository/Shapes/Mario in order to allow Tableau to recognize the images as shapes. Below are Mario’s shapes I created:

Up 1

Up 2

Down 1

Down 2

Left 1

Left 2

Right 1

Right 2

Start Mission
Drag Index to Marks Shelf under Shape Card, then click on the Shape card to edit the shapes. On the upper right there’s a dropdown to ‘ Select Shape Palette:’. The name of the folder you created previously should be listed here (in my case “Mario”). If it’s not listed click on Reload Shapes to re-read the directory where the images are placed. Once loaded assign the shapes to the labels from the column.
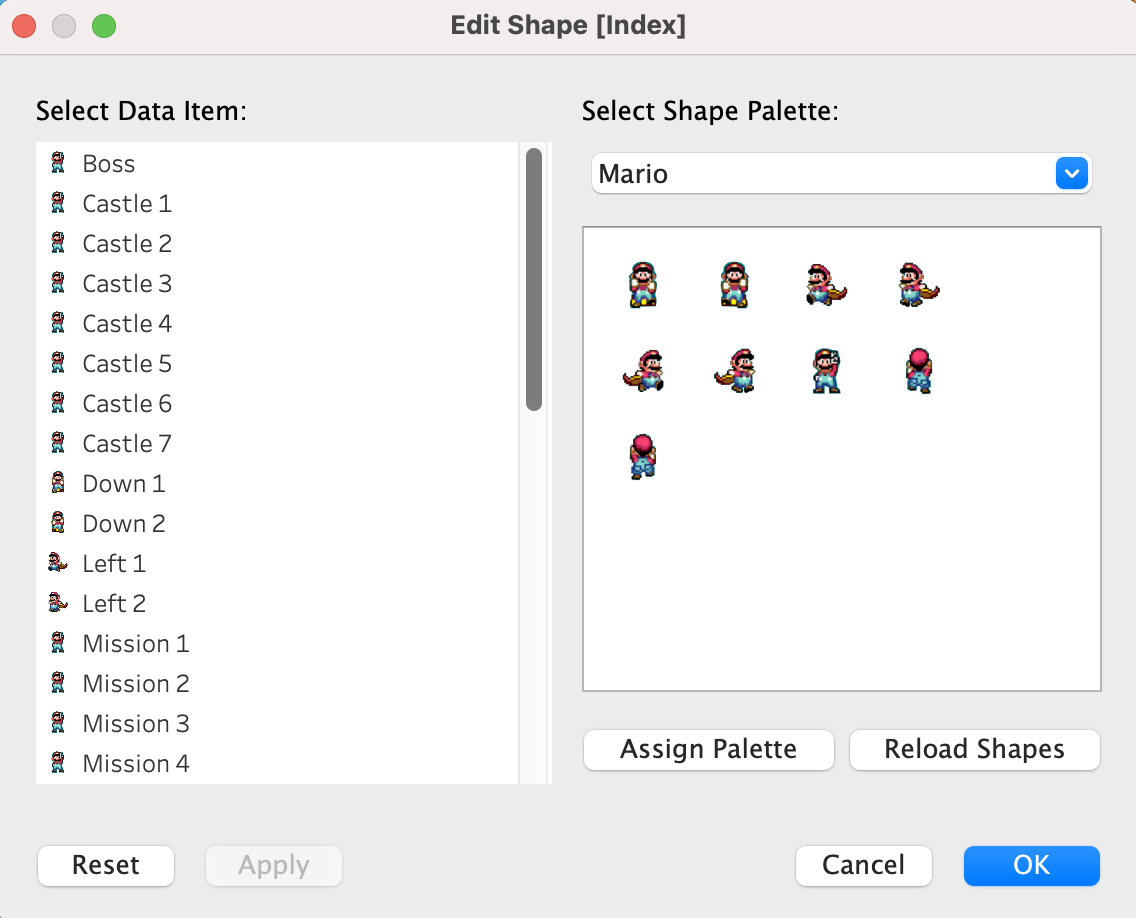
Assigned Mario shapes
At this point we have a Mario animation that walks through the plotted path on top of the map. I used the Mission Start points or castles as entry points for the slides. I created a simple dashboard that contained this sheet. The dashboard can be used to add visual elements which is not possible in the sheets and also to create a filter that syncronizes the text on my slide. I’ll show how I created the slide and the text on the next section.
Slides Viz
To display the content of the slides first I created a text Viz as follows. On a new sheet drag Slide Text column into Marks Shelf >> Text Card. Then drag Text Size column into Marks Shelf >> Size Card, this applies the text size according to the type of entry headings, sub-headings, regular text, etc. You will have the text for all slides on the viz area, we’ll filter this out later. Additionally I added the text size to Marks Shelf >> Color Card to identify different parts of the text easily. Select a background image for the slides, this image will be placed on a Dashboard, however it is important now to adjust the color range of the text to make it stand when in front of the picture. The image below shows the filter already applied, for now we’ll have the text for all slides don’t worry about this now.
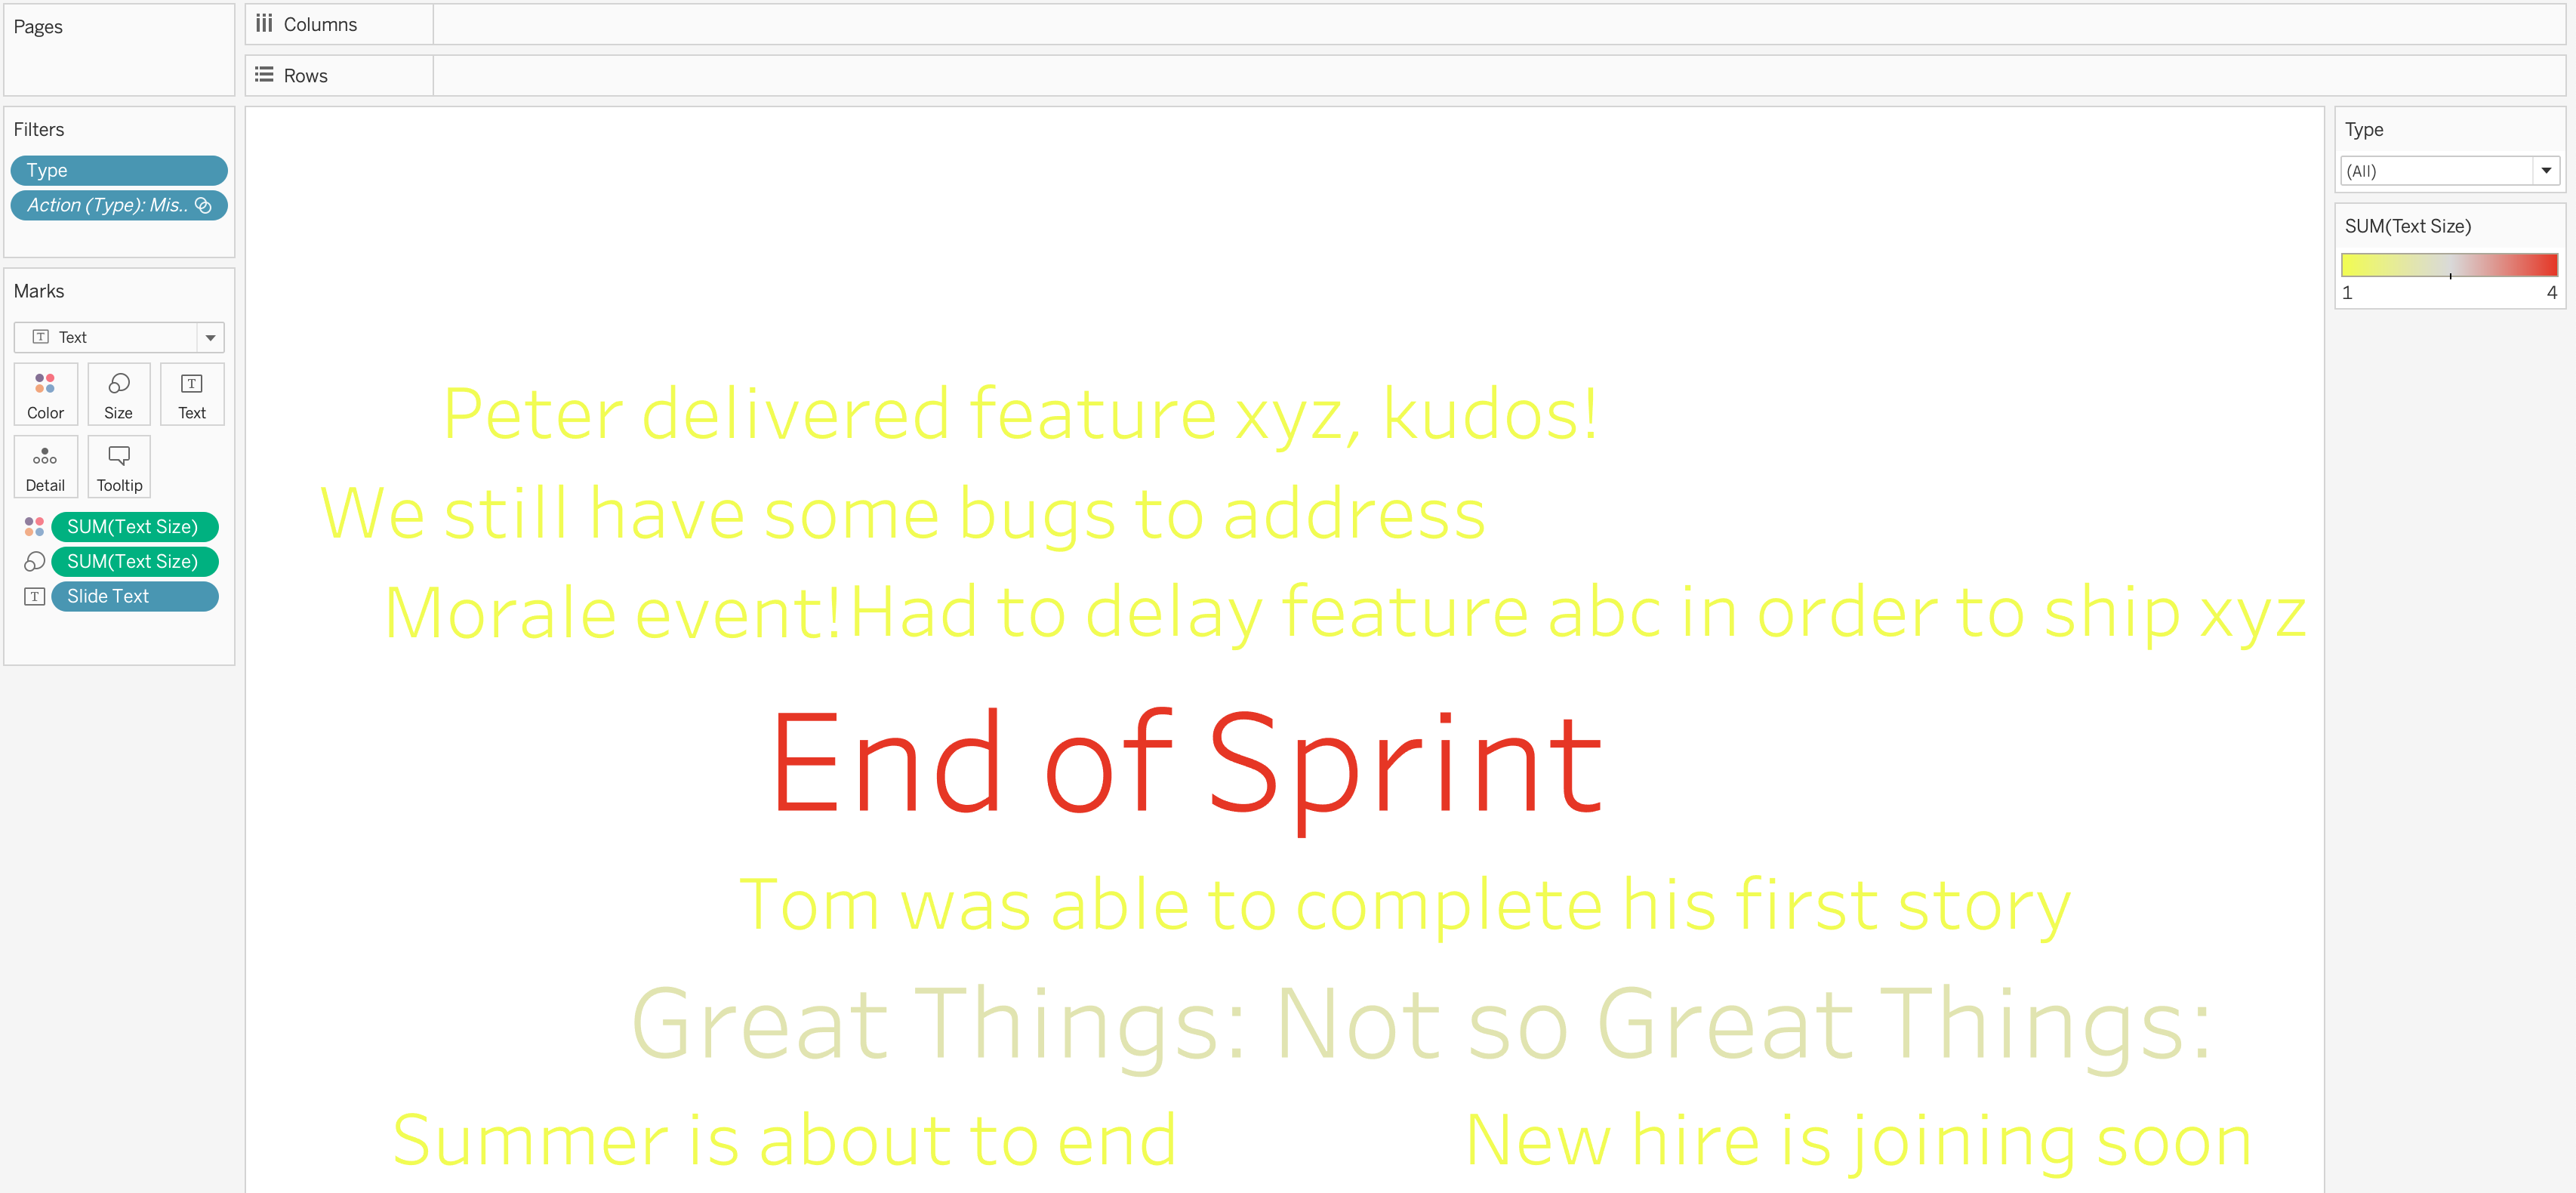
Text slide viz
Next create a new Dashboard, then drag the Image control on the dashboard area and load the image that will serve as background for the slides. Drag now the text viz we created on the previous step, make this control floating and position it on top of the image (now in the background).
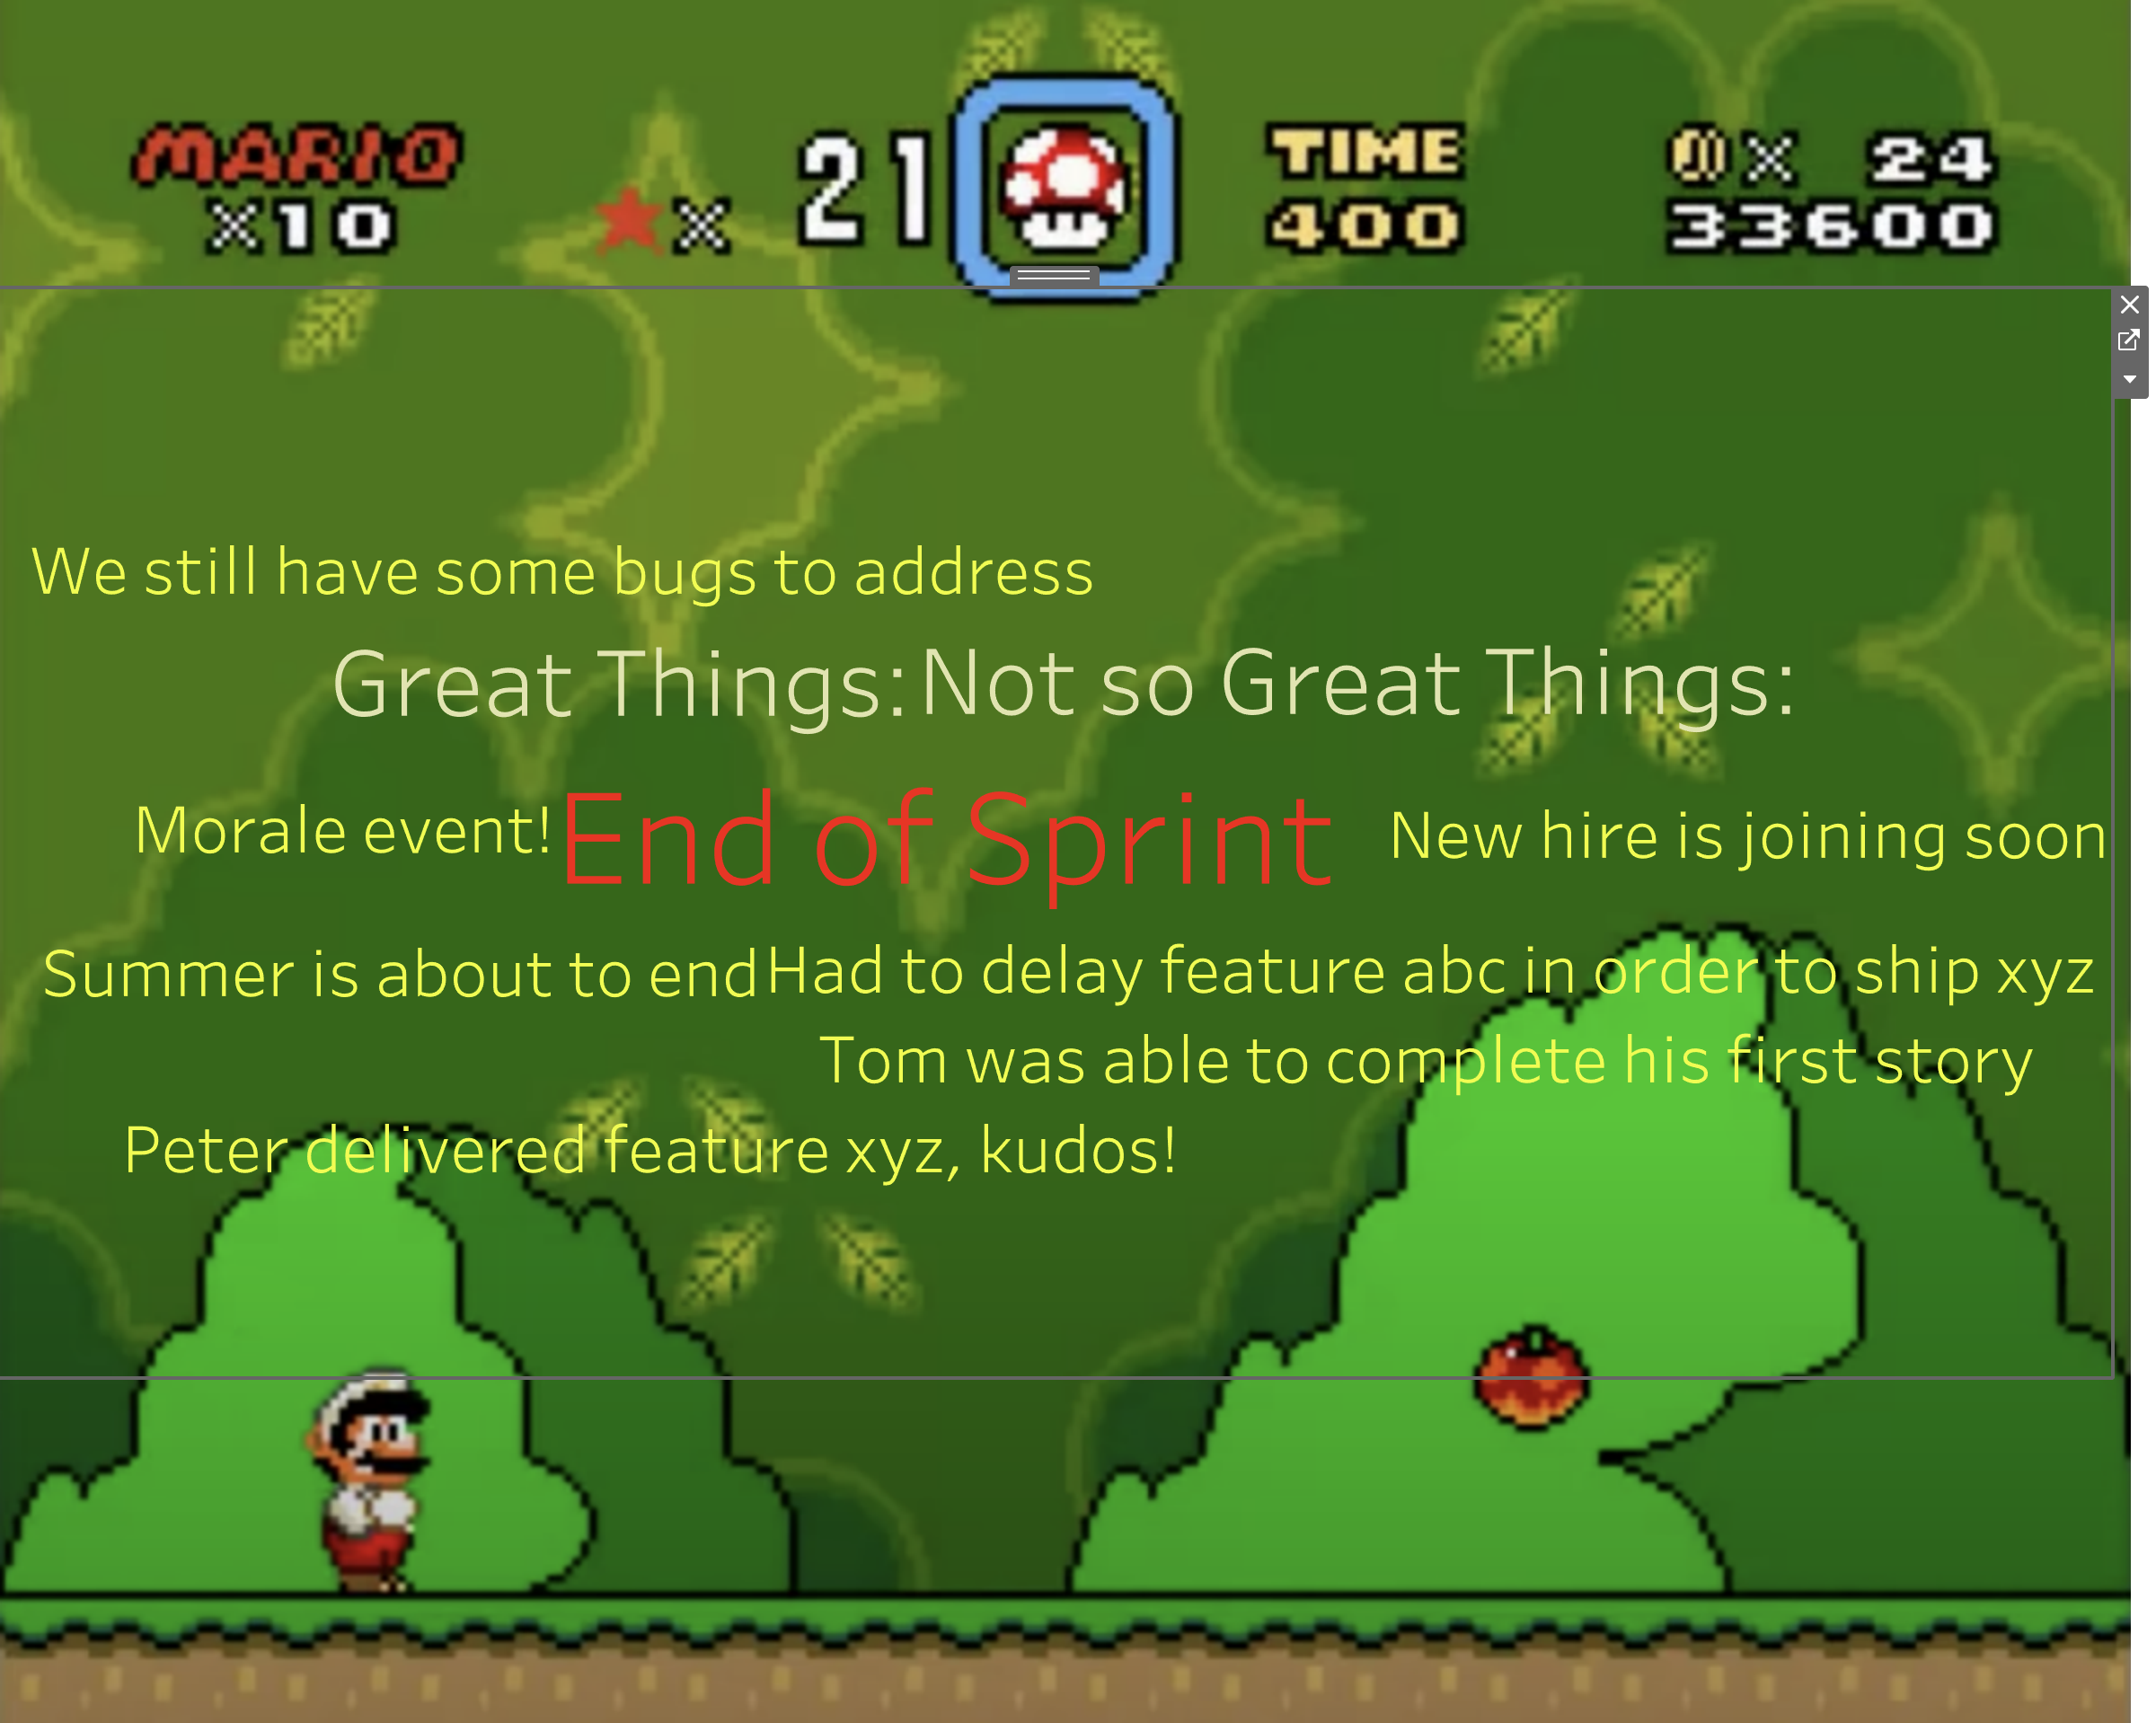
Slides Dashboard
Synchronize Dashboards
Final step is to use Mario on our map to filter the content of the slide and allow us to navigate to the slide on click, that way when we stop we can go to the slides in our presentation, then back to Mario’s path where he advances to the next mission where the text for the second slide will be updated and we can navigate to it, and this process repeats until we go through all slides. The control for the Pages shelf allows to stop, go back or jump to specific steps, this proved handy while doing the actual presentation. To create the filter, go to the map Dashboard (Mario’s world in my case) then Dashboard >> Actions..., click on Add Action >> Filter... and set the filter as shown in the image below. Make sure to correlate the Source and the Target Field in the bottom part with the column that groups the same text for the slides (in my case ‘Type’). For this correlation to work make sure you bring the field into the involved worksheets
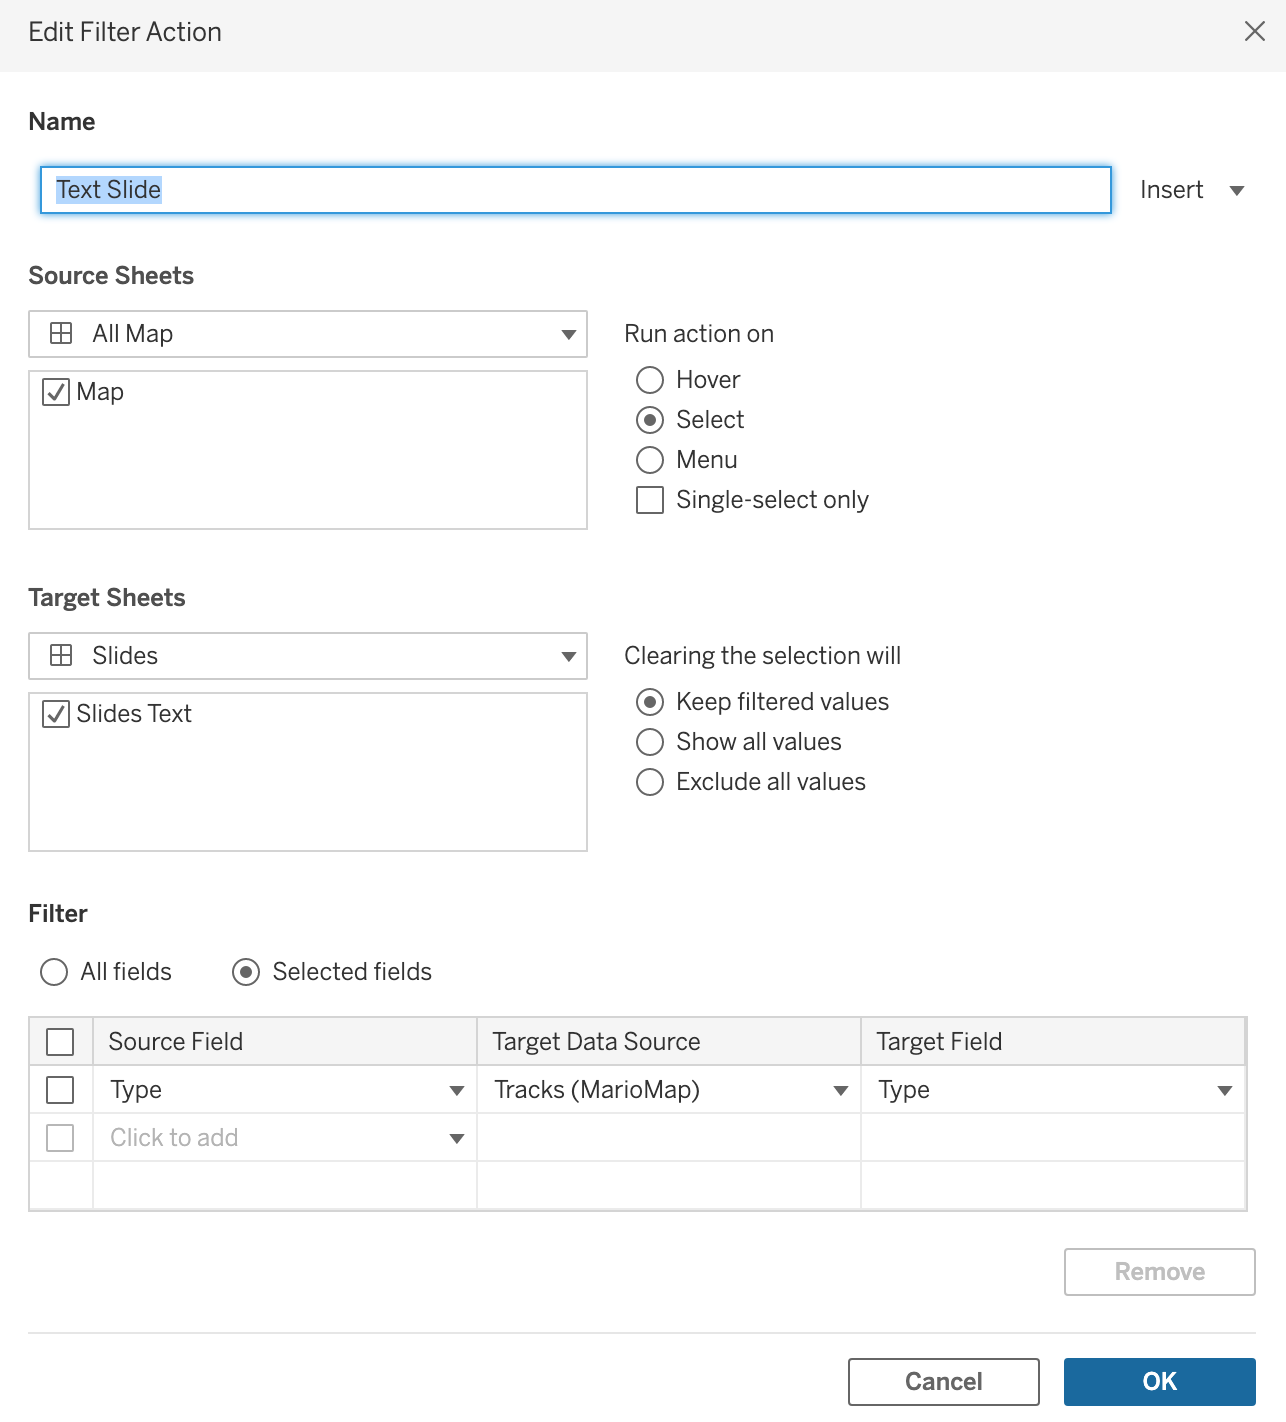
Filter Action
This should do the trick, as Mario progresses, upon clicking on him the text will be filtered according to the stage he’s in as defined by my column Type.
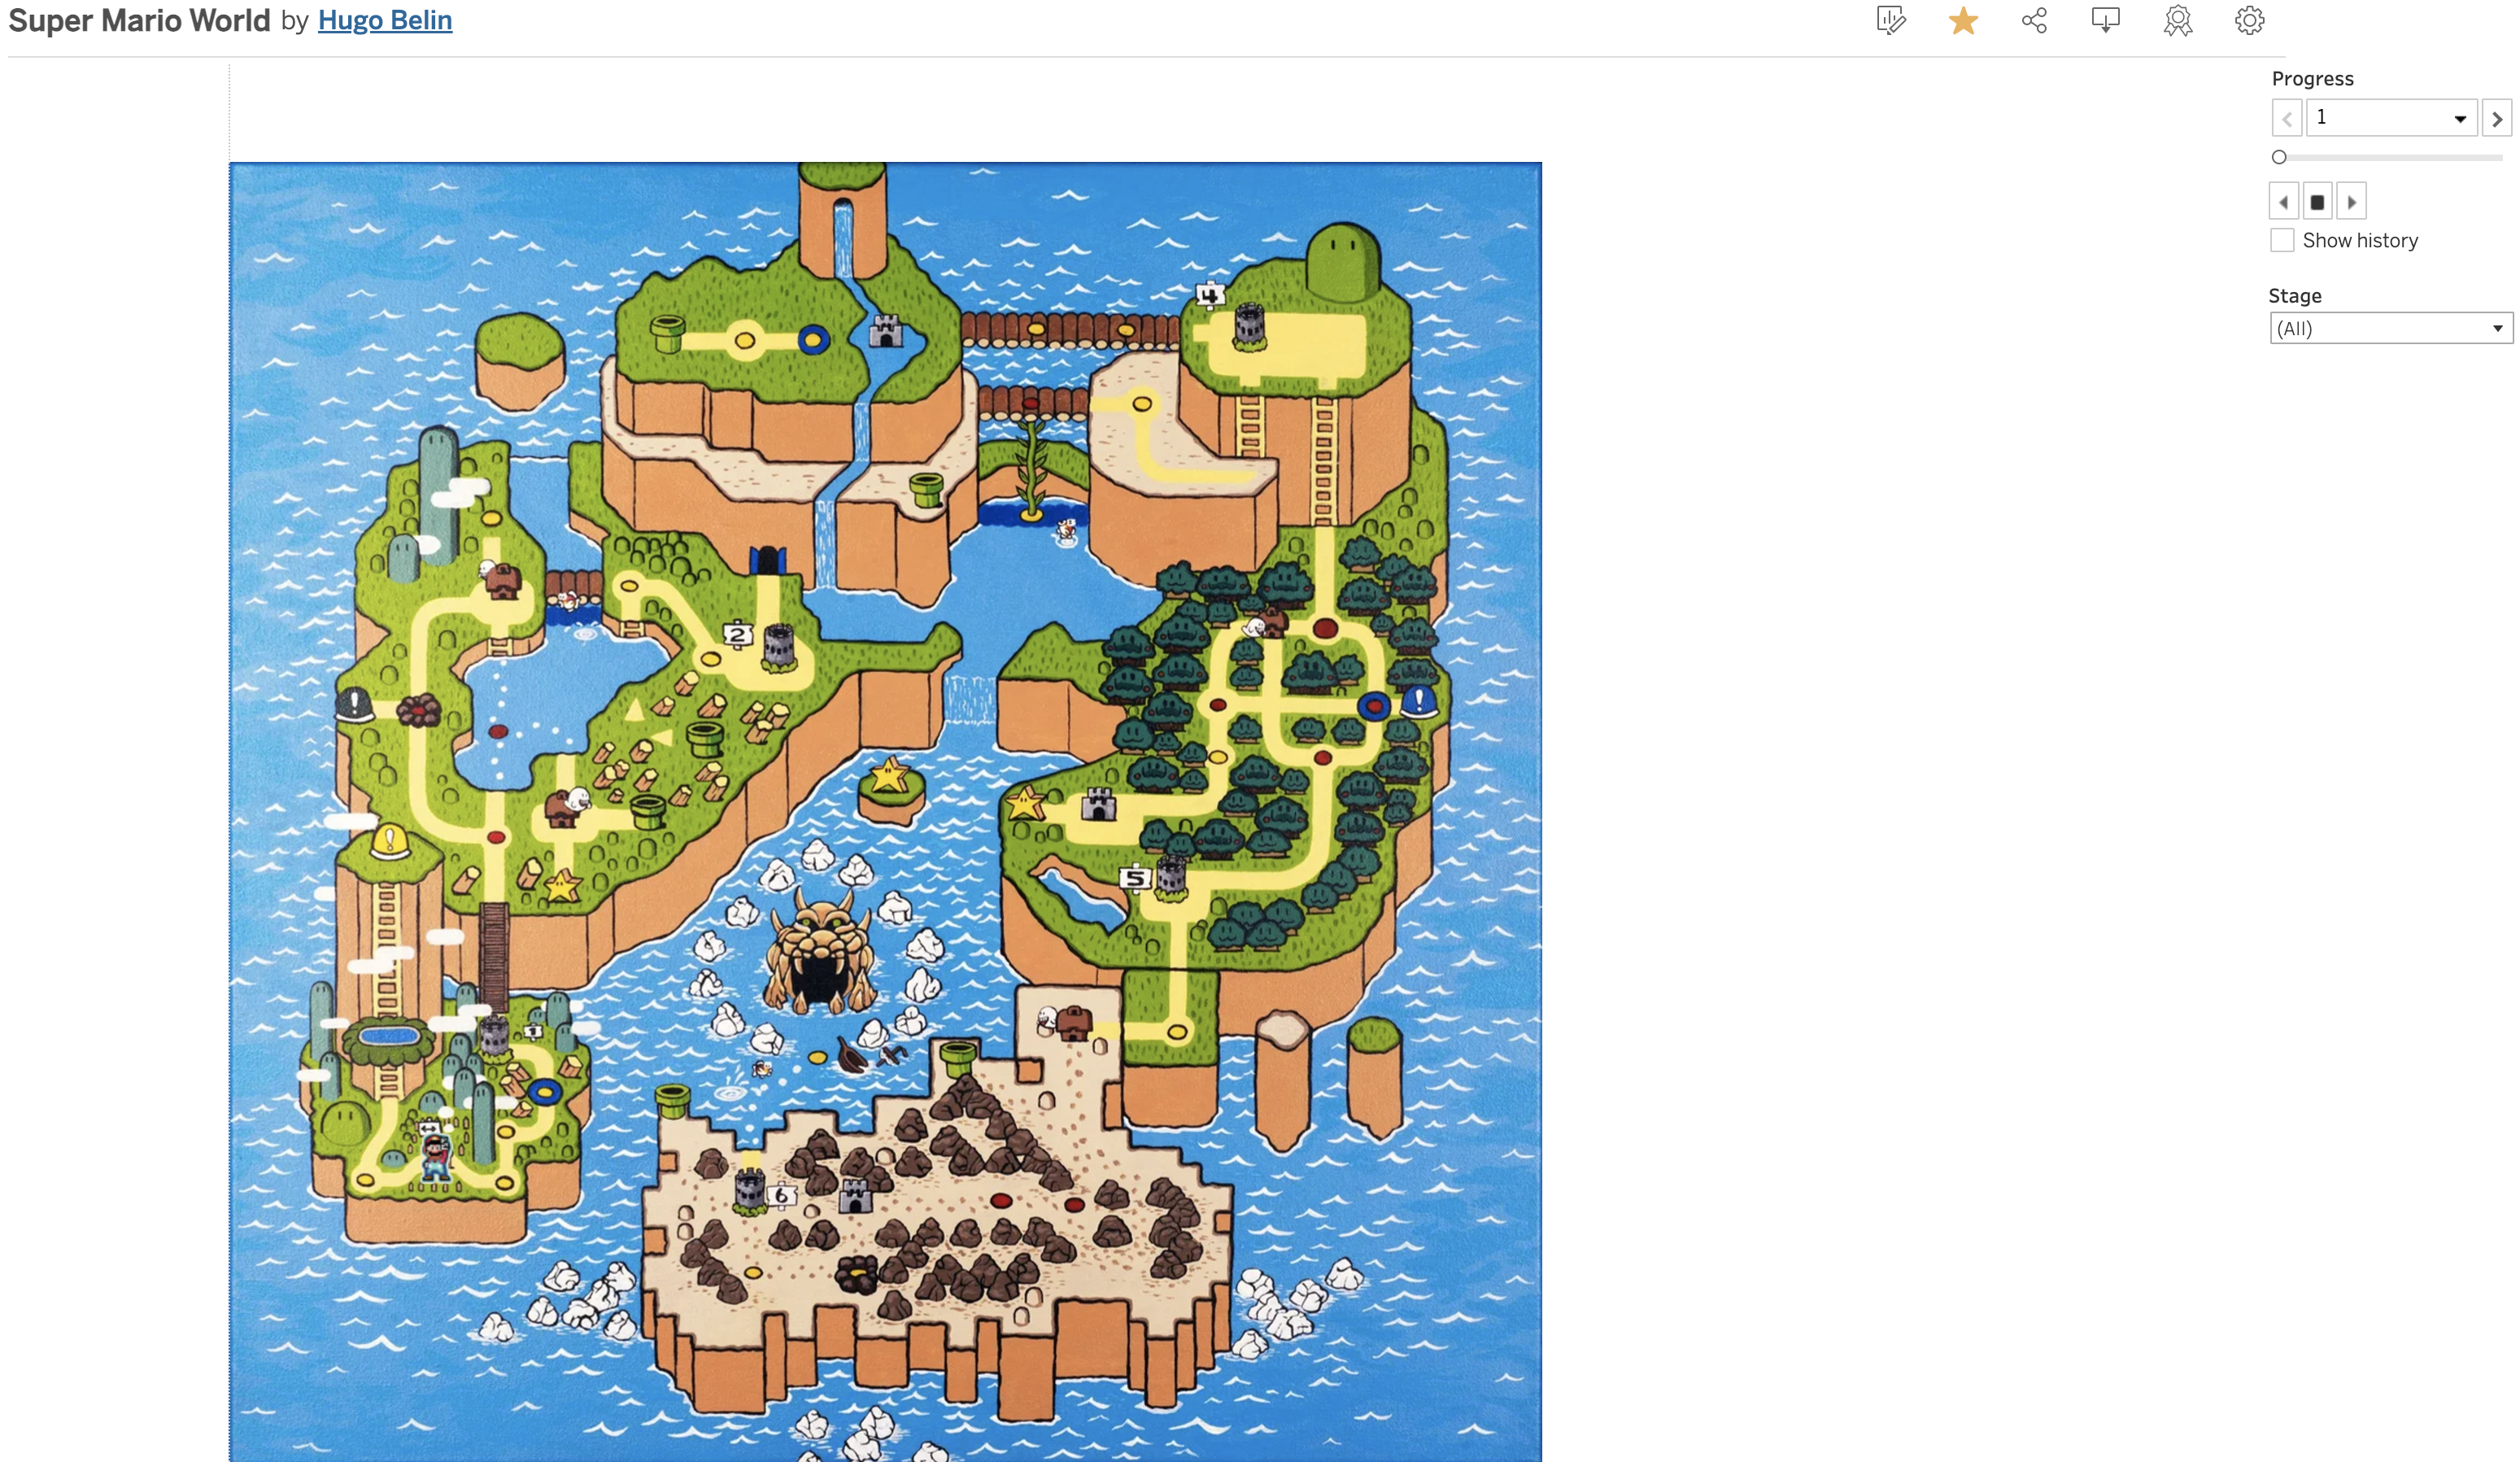
Final Viz
You can see my viz in action in Tableau Public or embedded below
Happy presenting!